.svg)

Sep-2026
Sales
Trend
6-Month
Product Count
SKUs
Avg Price
YoY Sales Change
YoY Price Change


Where to Buy
Breez is stocked at 273 licensed dispensaries across California and Illinois, 209 of them in California, with the deepest coverage in Los Angeles, San Diego, San Francisco, La Mesa, and Santa Rosa. Search by ZIP code or city below to find the closest one, or filter by product type if you are after a specific format.
Market Insights Snapshot
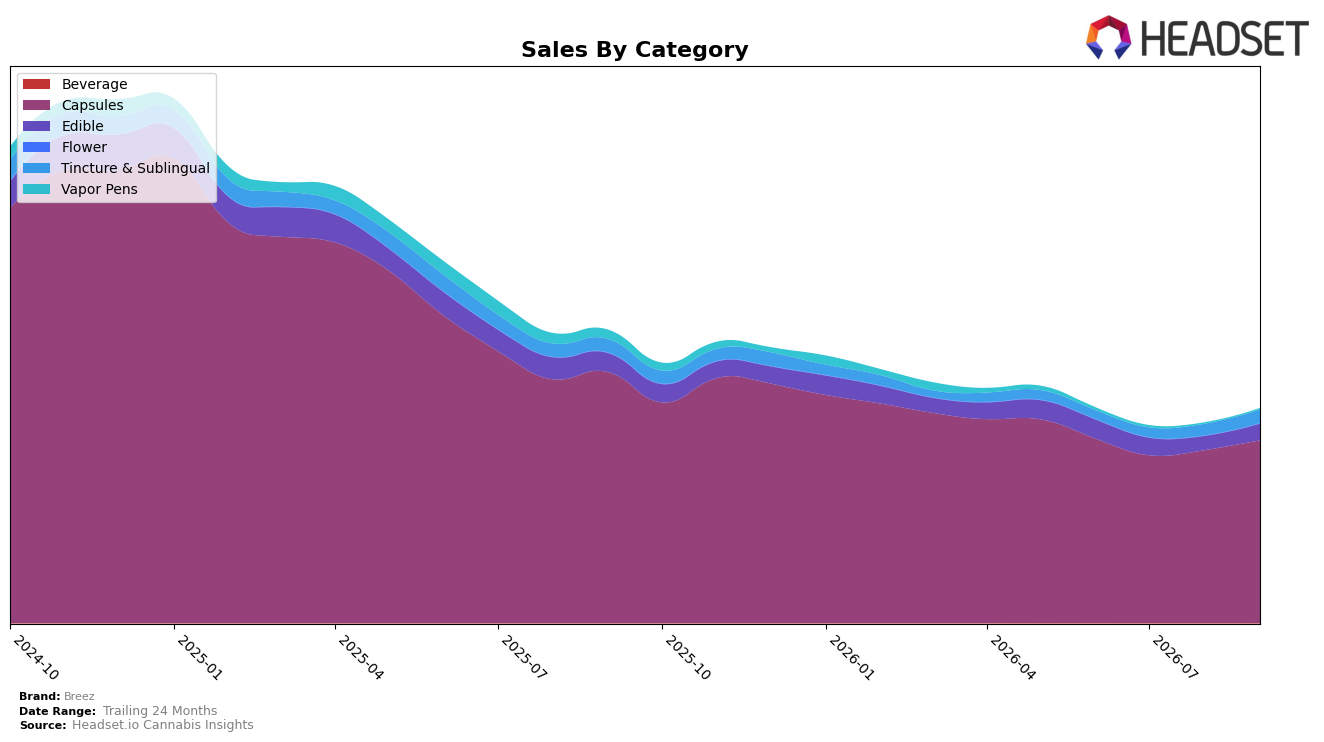
In September 2026, Capsules concentrated 85.59% share with a month-over-month gain of 5.69% but a year-over-year drop of 27.25%, while Edible held 7.65% share with 17.13% MoM growth and a 12.67% YoY decline. Tincture & Sublingual accounted for 6.24% share, rising 18.26% MoM and 0.79% YoY, contrasting with Vapor Pens at 0.49% share, down 2.26% MoM and 88.35% YoY; Beverage remained at 0.04% share with a 71.46% MoM uptick from a low base. Despite an average price up 1.04% YoY to $38.59, overall brand sales fell 26.89% YoY and 54.24% over 24 months, implying the portfolio is anchored in Capsules and vulnerable to demand swings in that category even as smaller formats add incremental MoM volume.
Within California Capsules, Breez ranked #2, and the category’s 85.59% mix combined with a 5.69% MoM lift suggests short-term traction where the brand is most established, while the 27.25% YoY drop signals reliance on a declining core. The Edible and Tincture & Sublingual gains of 17.13% and 18.26% MoM, respectively, alongside a 0.79% YoY uptick in Tincture & Sublingual, indicate adjacent formats are beginning to offset Capsule volatility, whereas Vapor Pens’ 88.35% YoY contraction and 0.49% share cap near-term cross-category expansion. The pattern implies Breez’s positioning is concentrated in a high-rank Capsule niche that sustains rank but compresses total addressable demand, with emerging momentum in Edible and Tincture & Sublingual offering the practical path to rebalance mix without diluting the #2 Capsule position.
Competitive Landscape
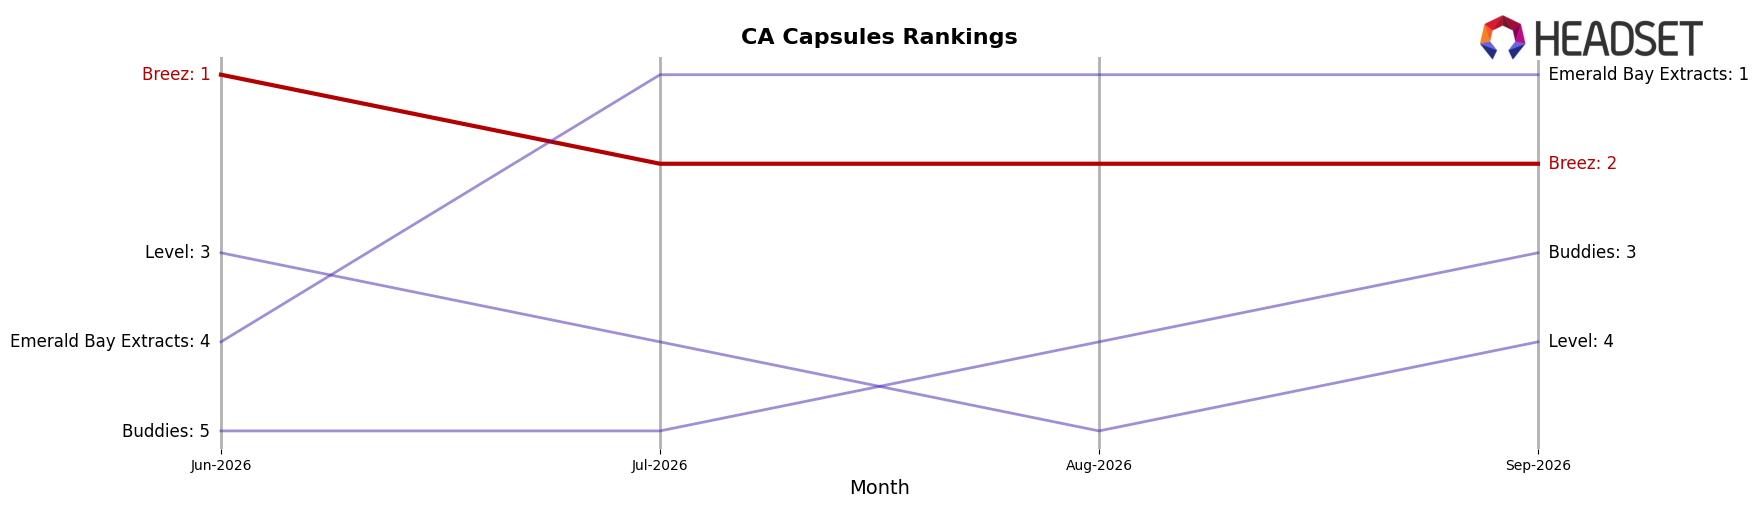
Breez is ranked #2 in CA Capsules in September 2026, unchanged year over year at #2 but down from #1 in June 2026, indicating a 1-place dip over three months while still within the top two. Emerald Bay Extracts moved from #6 year over year to #1 with 109.3% YoY sales growth, while Buddies sits at #3 after rising from #5 year over year with 39.1% YoY sales growth, creating pressure on Breez’s hold between #1 and #2. In contrast, Level is at #4 with a 1-place YoY rank change and a -50.3% YoY sales decline, reducing near-term threat below the top three. The pattern implies Breez’s flat YoY rank at #2 and short-term slide from #1 to #2 point to a market where surging competitors can displace brief peaks unless Breez converts peak-month momentum from June 2026 into sustained share defense.
Notable Products
Original Mint Tin 20-Pack (100mg) posted the largest move in September 2026 with +96.0% MoM, jumping into rank 4 while CBD/THC 1:1 Relief Cinnamon Mints 20-Pack (100mg CBD, 100mg THC) fell -14.7% MoM at rank 6, and this divergence indicates edibles momentum is concentrated in a single SKU rather than broad-based. Indica Extra Strength Tablet 50-Pack (1000mg) held rank 1 with +5.9% MoM and $172,706 in sales, while Sativa Extra Strength Tablet 50-Pack (1000mg) climbed +14.7% MoM at rank 2, implying Capsules leadership is stable at the very top despite mixed results such as Hybrid Extra-Strength Tablet 50-Pack (1000mg) slipping -4.0% at rank 3. Four of the top ten are Edible SKUs but five are Capsules, and with CBD Extra Strength Recovery Tablet 50-Pack (1000mg CBD) up +27.3% MoM at rank 8 alongside the nighttime 2:1:1 variant flat at +0.5% at rank 5, the mix points to Capsules anchoring revenue while selective Edible hits provide episodic spikes. Taken together, Breez’s commercial direction tilts toward defending high-rank Capsules while testing Edible breakouts that can add step-changes without displacing the core.
Top Selling Cannabis Brands






Data for this report comes from real-time sales reporting by participating cannabis retailers via their point-of-sale systems, which are linked up with Headset’s business intelligence software. Headset’s data is very reliable, as it comes digitally direct from our partner retailers. However, the potential does exist for misreporting in the instance of duplicates, incorrectly classified products, inaccurate entry of products into point-of-sale systems, or even simple human error at the point of purchase. Thus, there is a slight margin of error to consider. Brands listed on this page are ranked in the top twenty within the market and product category by total retail sales volume.

