Jan-2025
Sales
Trend
6-Month
Product Count
SKUs
Overview
Market Insights Snapshot
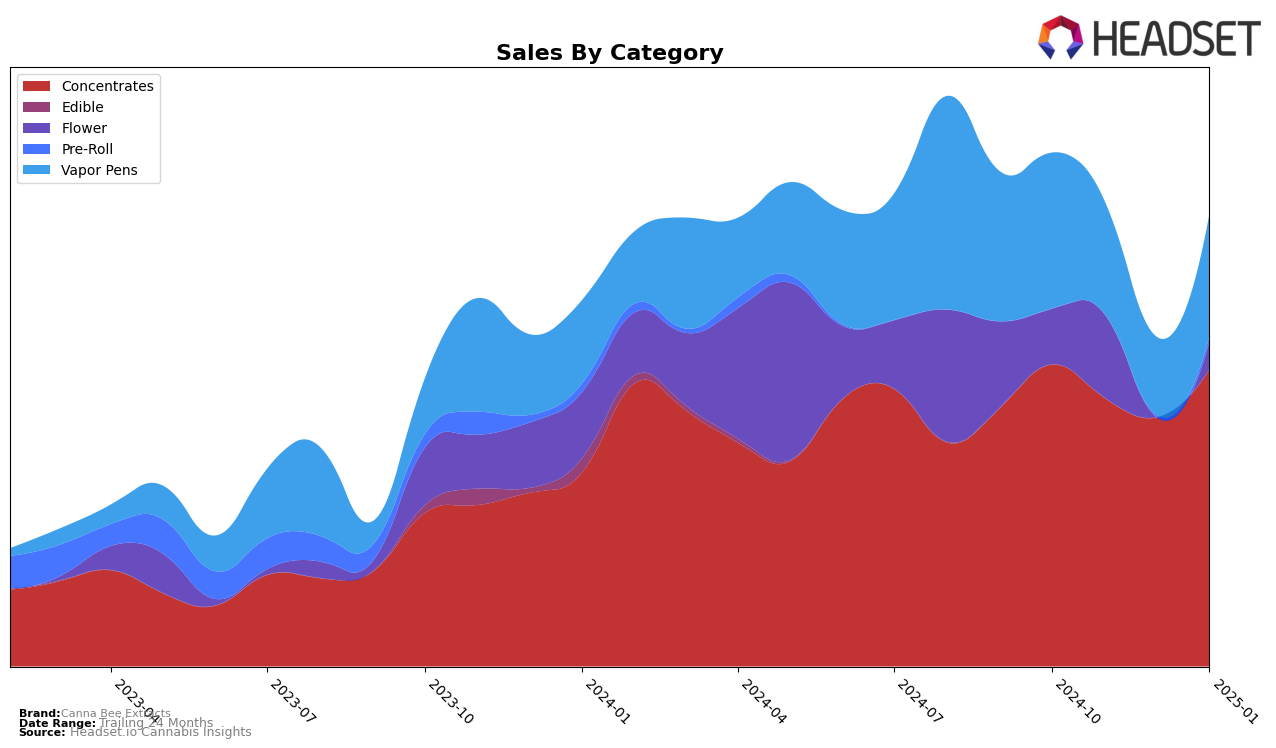
Canna Bee Extracts has shown a fluctuating performance in the Michigan market, particularly within the concentrates category. The brand managed to secure a spot in the top 30 consistently, with rankings ranging from 23rd to 30th over the period from October 2024 to January 2025. Notably, there was an improvement in January 2025, where the brand climbed back to 22nd position, indicating a positive trend after a dip in the previous months. This upward movement suggests a potential recovery or strategic adjustment that might have been made to regain market share. However, the sales figures show a decline from October to December, followed by a rebound in January, hinting at possible seasonal factors or competitive pressures affecting their market performance.
In contrast, the vapor pens category paints a more challenging picture for Canna Bee Extracts in Michigan. The brand did not manage to break into the top 30, with rankings hovering between 75th and 91st. This indicates a significant gap in market presence within this category, which might be due to stronger competition or less consumer demand for their vapor pen products. The sales trend in this category also reflects a downward trajectory from October to December, with a slight recovery in January, although remaining far from the top-performing brands. This suggests that while there might be a niche following for their products, broader market dynamics or product positioning could be limiting their growth potential in this segment.
Competitive Landscape
In the competitive landscape of the Michigan concentrates market, Canna Bee Extracts has shown a dynamic shift in rankings over the past few months. Starting from October 2024, Canna Bee Extracts held the 23rd position, but experienced a dip in November, falling to 30th place. However, the brand demonstrated resilience and climbed back to 22nd place by January 2025. This fluctuation highlights the competitive pressure from brands like Cloud Cover (C3), which consistently hovered around the mid-20s, and Humblebee, which improved its rank from 35th to 23rd over the same period. Notably, High Minded maintained a strong presence, consistently ranking within the top 20, which signifies a significant competitive threat. Meanwhile, GreenCo Ventures experienced a decline from 13th to 21st, suggesting potential market volatility. These movements indicate that while Canna Bee Extracts is regaining momentum, the brand must strategize effectively to navigate the competitive pressures and sustain its upward trajectory in sales and rankings.

Notable Products
In January 2025, the top-performing product from Canna Bee Extracts was Jokers Wild Live Resin Moon Rocks (1g) under the Concentrates category, achieving the number one rank with sales of 834 units. The White Runtz Live Resin Disposable (1g) followed closely in the Vapor Pens category, moving up to the second position from its previous third place in October 2024. Sunshine Gelato Cream Live Resin Disposable (1g) secured the third spot, showing strong sales performance in the Vapor Pens category. Sonic Jelly Live Resin (1g) ranked fourth in Concentrates, while Cadillac Rainbow Live Resin Disposable (1g) rounded out the top five in Vapor Pens. These rankings indicate a notable rise in popularity and sales for vapor pen products compared to prior months.
Top Selling Cannabis Brands
Data for this report comes from real-time sales reporting by participating cannabis retailers via their point-of-sale systems, which are linked up with Headset’s business intelligence software. Headset’s data is very reliable, as it comes digitally direct from our partner retailers. However, the potential does exist for misreporting in the instance of duplicates, incorrectly classified products, inaccurate entry of products into point-of-sale systems, or even simple human error at the point of purchase. Thus, there is a slight margin of error to consider. Brands listed on this page are ranked in the top twenty within the market and product category by total retail sales volume.


