.svg)


Market Insights Snapshot
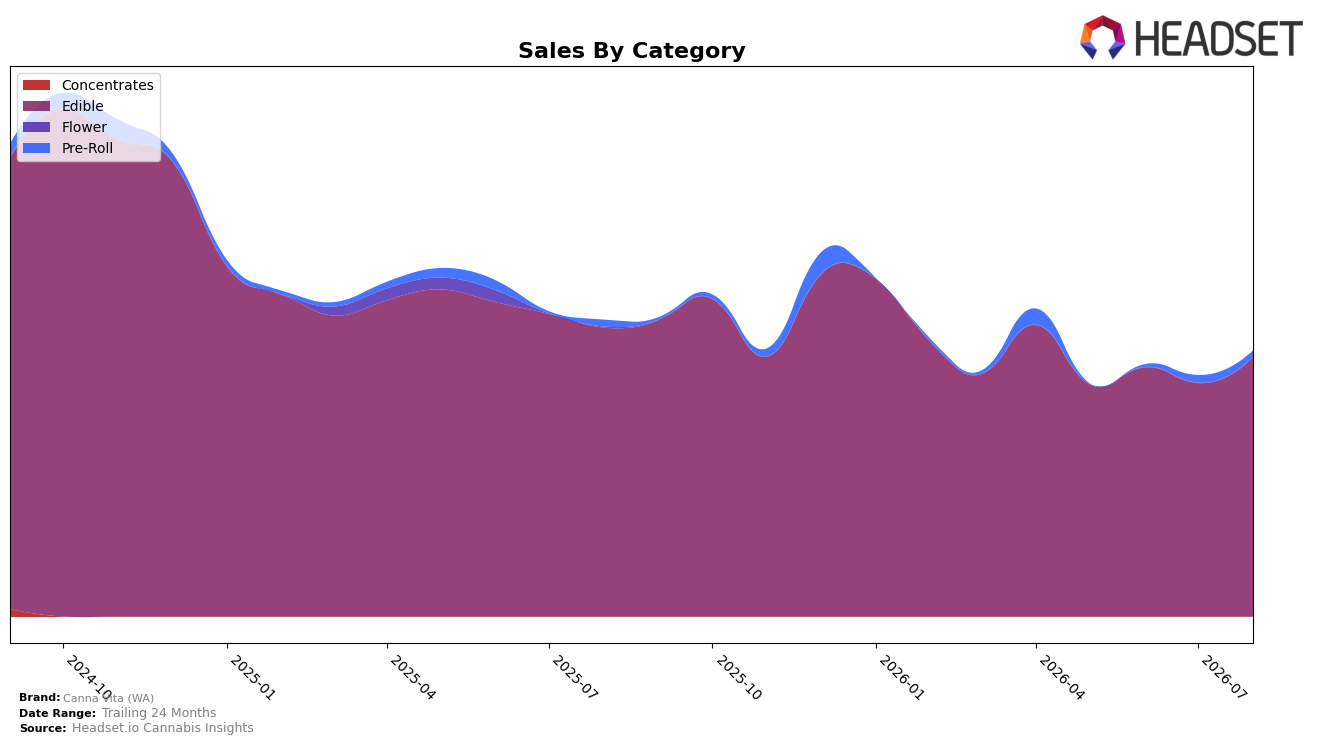
In August 2026, Canna Vita (WA) concentrated 97.85% of sales in Edible while Pre-Roll accounted for 2.15%, indicating a highly skewed mix toward a single category. Within Edible, month-over-month sales rose 11.17% even as year-over-year declined 10.22%, while Pre-Roll fell 20.43% MoM and was down 10.92% YoY; together these shifts produced a 4.54% YoY drop in average price alongside a brand-level YoY sales contraction of 10.41%. With Edible ranked 42 in Washington, the mix suggests reliance on one category for recovery momentum, implying that short-term gains are being driven by Edible MoM lift rather than diversified category strength.
The pattern implies a value-leaning Edible strategy is cushioning broader declines: Edible’s 11.17% MoM growth against a 10.22% YoY dip, combined with a brand-wide 4.54% YoY price decrease and Pre-Roll’s 20.43% MoM slide, points to price-sensitive demand consolidation in the core line. Given the 42 rank position in Washington Edibles and a 2.15% share in Pre-Roll, the brand is positioned as an Edible-focused player trading volume for price efficiency, implying that sustaining share will depend on defending Edible’s MoM momentum while limiting further Pre-Roll erosion.
Competitive Landscape
Canna Vita (WA) sits at rank #42 in WA Edible for August 2026 with a 0-place YoY rank change from #42, while improving 3 positions versus three months ago from #45 and remaining 9 spots below its peak of #33 in October 2024; against this, Wyld held #1 with a +5.1% YoY sales change and Green Revolution held #2 with a -7.0% YoY sales change, indicating Canna Vita (WA) held share position rather than capturing the top-tier shifts despite leaders diverging in growth rates, which implies a stable but stagnant rank trajectory that limits near-term upside without a discrete share-accretive move.

Notable Products
Milk Chocolate Bite (100mg) posted the largest movement in August 2026 with a 74.7% month-over-month gain, jumping into a shared rank of 7, while Hazelnut Chocolate Candy (100mg) fell 43.5% to rank 6, indicating volatility concentrated in the mid-tier SKUs. At the top, CBD Milk Chocolate Squares 10-Pack (100mg CBD) rose 8.2% to rank 1 and Dark Chocoate Espresso (100mg) climbed 46.5% to rank 2, while Dark Chocolate Mint Sugar Free Candies (100mg) slipped 8.8% at rank 5, pointing to momentum favoring classic formats over mint variants. Eight of the top ten are Edible chocolates across milk, dark, and sugar-free lines, and the cluster of ties at rank 7 signals SKU crowding that could dilute velocity; consolidating toward faster-moving milk and espresso profiles would align assortment with observable demand shifts.
Top Selling Cannabis Brands






Data for this report comes from real-time sales reporting by participating cannabis retailers via their point-of-sale systems, which are linked up with Headset’s business intelligence software. Headset’s data is very reliable, as it comes digitally direct from our partner retailers. However, the potential does exist for misreporting in the instance of duplicates, incorrectly classified products, inaccurate entry of products into point-of-sale systems, or even simple human error at the point of purchase. Thus, there is a slight margin of error to consider. Brands listed on this page are ranked in the top twenty within the market and product category by total retail sales volume.

