Aug-2025
Sales
Trend
6-Month
Product Count
SKUs
Overview
Market Insights Snapshot
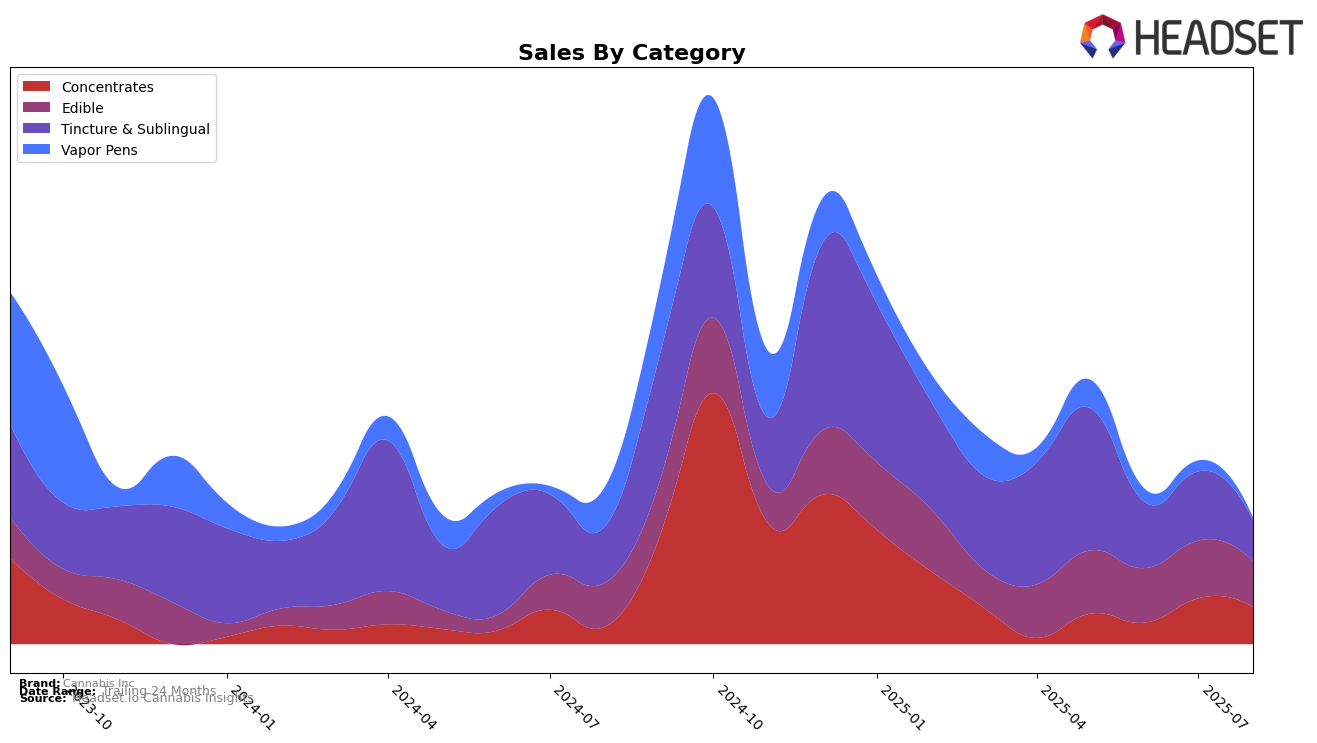
Cannabis Inc's performance in the Missouri market, particularly in the Tincture & Sublingual category, reveals some intriguing dynamics. As of May 2025, the brand held a solid 5th place ranking, which indicates a strong foothold in this niche market. However, the absence of rankings in June, July, and August suggests that Cannabis Inc fell out of the top 30 brands in Missouri for this category. This decline could point to increased competition or a shift in consumer preferences, highlighting a potential area of concern for the brand's market strategy in Missouri.
While Cannabis Inc's sales figures for May 2025 were recorded at $12,009, the lack of data for subsequent months could indicate a downward trend or a need for strategic realignment. The brand's initial success in the Tincture & Sublingual category might have been due to a specific promotional effort or seasonal demand, but sustaining that momentum appears to be a challenge. Understanding the factors behind this drop in rankings and exploring how Cannabis Inc can regain its standing could be crucial for stakeholders and investors looking to capitalize on the brand's potential in the Missouri market.
Competitive Landscape
In the Missouri Tincture & Sublingual category, Cannabis Inc experienced a notable shift in its competitive positioning from May to August 2025. Initially ranked 5th in May, Cannabis Inc was absent from the top 20 list in subsequent months, indicating a significant decline in its market presence. This contrasts sharply with competitors such as Zen Cannabis, which maintained a strong position, ranking 2nd in June and July before dropping slightly to 3rd in August. Meanwhile, Mary's Medicinals consistently held the 4th spot in June and July, though it also disappeared from the rankings in August. The consistent sales performance of Zen Cannabis, despite a downward trend, highlights the competitive pressure on Cannabis Inc, which needs to address its market strategy to regain traction and improve its ranking and sales in this category.

Notable Products
In August 2025, the top-performing product for Cannabis Inc was Apple Cinnamon Greenola Bites 10-Pack, which climbed to the number one spot in the Edible category with sales of 66 units. The Rosin Extra Strength Tincture (300mg THC, 30ml) secured the second position, maintaining a steady presence in the Tincture & Sublingual category despite fluctuating ranks in previous months. The Rosin Tincture (100mg THC, 30ml) dropped to third place, indicating a decline in sales momentum. Berries & Chocolate Greenola Bites 10-Pack and Original Greenola Bites 10-Pack both tied for fourth place, demonstrating consistent performance in the Edible category. Notably, Apple Cinnamon Greenola Bites showed significant growth, leaping from an unranked position in July to the top rank in August.
Top Selling Cannabis Brands
Data for this report comes from real-time sales reporting by participating cannabis retailers via their point-of-sale systems, which are linked up with Headset’s business intelligence software. Headset’s data is very reliable, as it comes digitally direct from our partner retailers. However, the potential does exist for misreporting in the instance of duplicates, incorrectly classified products, inaccurate entry of products into point-of-sale systems, or even simple human error at the point of purchase. Thus, there is a slight margin of error to consider. Brands listed on this page are ranked in the top twenty within the market and product category by total retail sales volume.

