Jan-2025
Sales
Trend
6-Month
Product Count
SKUs
Overview
Market Insights Snapshot
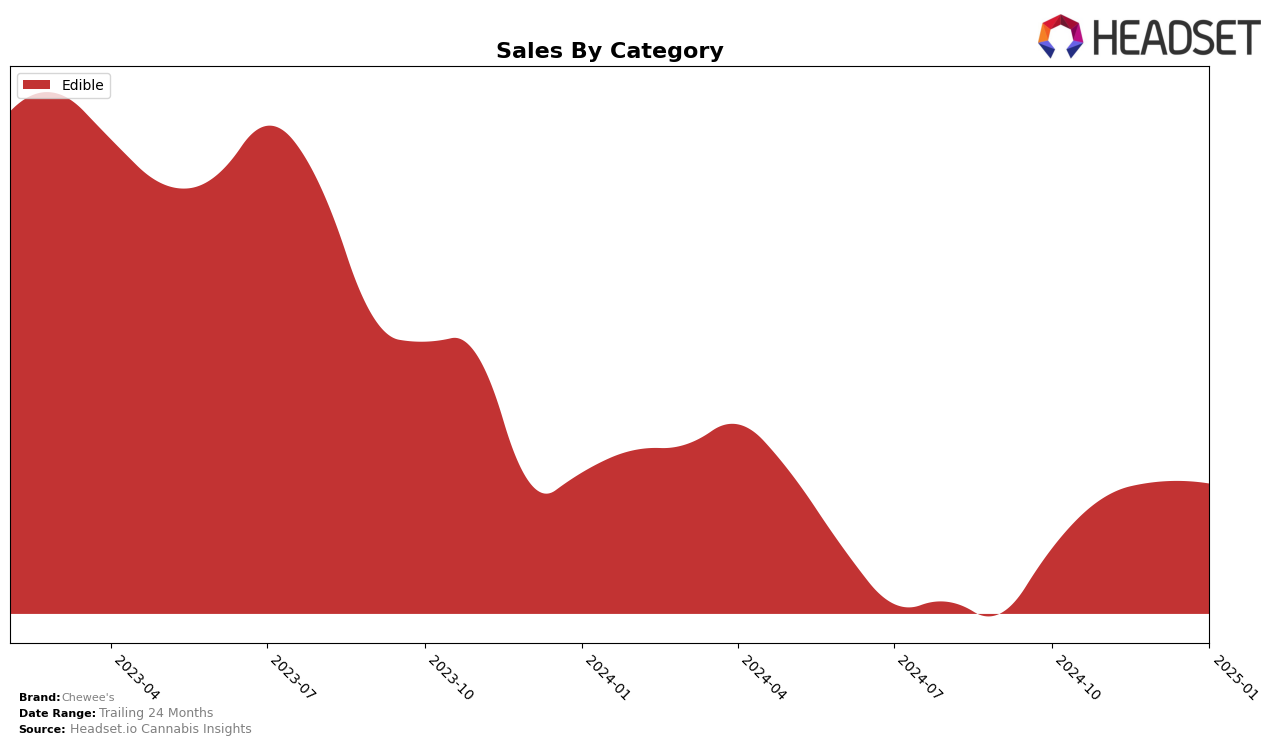
Chewee's has shown varied performance across different states and categories, reflecting both challenges and opportunities for growth. In Massachusetts, Chewee's has not broken into the top 30 rankings in the Edible category from October 2024 through January 2025. This indicates a significant opportunity for improvement, as the brand's presence in this market is currently minimal. Despite not being in the top 30, there was a notable upward trend in sales from October to December 2024, suggesting some momentum that could be capitalized on with strategic initiatives. In contrast, the brand maintained a steady presence in the Washington Edible market, consistently ranking within the top 30, although it experienced a slight decline in sales over the same period.
In Washington, Chewee's ranked 28th in October 2024 and maintained a position within the top 30 through January 2025. However, the brand's sales figures reveal a gradual decline, suggesting potential market saturation or increased competition. This steady ranking amidst declining sales might indicate a need for innovation or marketing efforts to regain momentum and improve its standing. Conversely, Massachusetts presents a different scenario where the absence from the top 30 rankings could be seen as a call to action for Chewee's to enhance its market penetration and visibility. The contrasting performances in these two states highlight the diverse challenges and strategies required for Chewee's to optimize its market presence across different regions.
Competitive Landscape
In the Washington edible market, Chewee's has shown a consistent presence, albeit with some fluctuations in its ranking. Over the last few months, Chewee's has hovered around the 28th to 30th rank, indicating a stable yet challenging position in a competitive landscape. Notably, Agro Couture and Hi-Burst have maintained slightly better ranks, often placing in the mid-20s, which suggests they have a stronger market foothold. Despite Chewee's sales showing a slight downward trend, it remains competitive with brands like C4 Cannaburst, which consistently ranks lower. This indicates that while Chewee's is facing stiff competition, particularly from higher-ranked brands, it still holds a viable position to potentially climb the ranks with strategic marketing and product differentiation.

Notable Products
In January 2025, Chewee's top-performing product was the Sea Salt Caramel 10-Pack (100mg), which maintained its first-place ranking with a notable sales figure of 907 units. The Indica Classic Caramel 20-Pack (100mg) held steady in second place, continuing its strong performance from the previous months. The Sativa Classic Caramel 20-Pack (100mg) climbed to third place, improving from its previous fourth-place ranking in December 2024. The Indica Sea Salt Caramel Chews 10-Pack (100mg) dropped to fourth place, showing a decrease in sales compared to its previous months. Finally, the Sativa Sea Salt Caramel 10-Pack (100mg) remained consistent in fifth place, with a slight increase in sales over December 2024.
```Top Selling Cannabis Brands
Data for this report comes from real-time sales reporting by participating cannabis retailers via their point-of-sale systems, which are linked up with Headset’s business intelligence software. Headset’s data is very reliable, as it comes digitally direct from our partner retailers. However, the potential does exist for misreporting in the instance of duplicates, incorrectly classified products, inaccurate entry of products into point-of-sale systems, or even simple human error at the point of purchase. Thus, there is a slight margin of error to consider. Brands listed on this page are ranked in the top twenty within the market and product category by total retail sales volume.


