Mar-2025
Sales
Trend
6-Month
Product Count
SKUs
Overview
Market Insights Snapshot
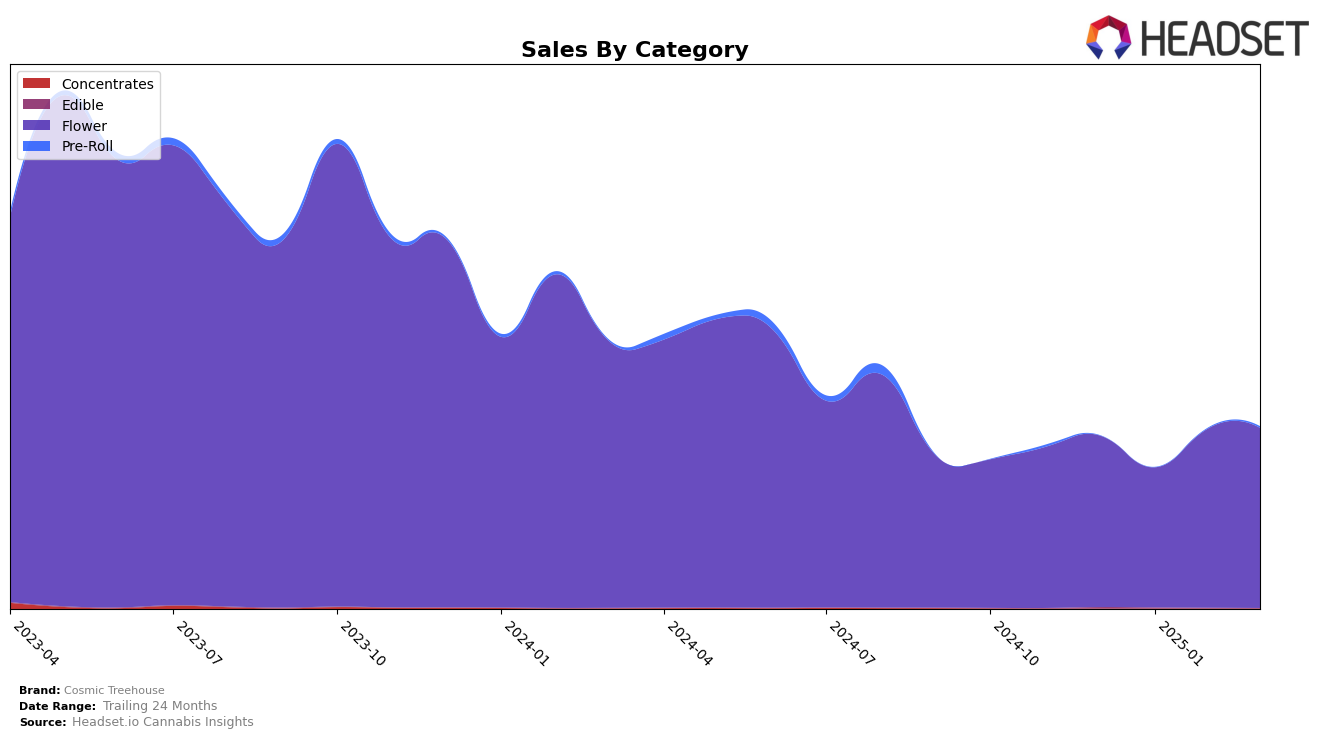
In Oregon, Cosmic Treehouse has shown a dynamic performance in the Flower category over the past few months. After not making it to the top 30 in December 2024 with a rank of 31, the brand slightly dropped to 32 in January 2025. However, a notable improvement was seen in February 2025, where they ascended to the 24th position, maintaining a strong presence by March 2025 with a rank of 27. This upward trend in February and March indicates a positive reception and potential growth in the Oregon market, especially in the Flower category, which is a crucial segment for many cannabis brands.
Despite the fluctuations in rankings, the sales figures for Cosmic Treehouse in Oregon suggest a steady demand. The brand experienced a dip in January 2025, but sales rebounded in February, maintaining a consistent level into March. This resilience in sales, despite not always being in the top 30, highlights Cosmic Treehouse's potential to capitalize on Oregon's competitive market landscape. The ability to bounce back and improve their standing in February is a testament to the brand's adaptability and appeal within the Flower category. However, the absence from the top 30 in December remains a point of concern that could signal areas needing strategic adjustments.
Competitive Landscape
In the competitive landscape of the Oregon flower market, Cosmic Treehouse has experienced notable fluctuations in its ranking, which have implications for its sales performance. From December 2024 to March 2025, Cosmic Treehouse's rank shifted from 31st to 27th, indicating a slight improvement in its competitive positioning. This upward trend contrasts with the performance of Alter Farms, which saw a significant leap from 66th to 29th, suggesting a more aggressive growth trajectory. Meanwhile, William's Wonder Farms maintained a relatively stable position within the top 30, though it experienced a dip in sales in February. Excolo and Evan's Creek Farms also showed dynamic movements, with Excolo improving its rank from 35th to 28th, and Evan's Creek Farms making a notable jump from 38th to 26th by March. These shifts highlight the competitive pressures Cosmic Treehouse faces, as it strives to enhance its market share amidst rapidly evolving competitor strategies.

Notable Products
In March 2025, Cosmic Treehouse's top-performing product was Purple Punch Popcorn (Bulk) in the Flower category, securing the number one rank with sales of 1177 units. Following closely, Green Crack Bitty's (Bulk) also in the Flower category, ranked second. Blueberry Cake (Bulk) maintained its strong position in third place, while Hash Burger (Bulk) held the fourth spot, both continuing their robust performance from previous months. Notably, Divine Banana Pre-Roll (1g) in the Pre-Roll category rounded out the top five, showing a consistent presence in the rankings. The rankings for these products have seen stability, with no significant changes from the previous months, indicating a steady demand for Cosmic Treehouse's offerings.
Top Selling Cannabis Brands
Data for this report comes from real-time sales reporting by participating cannabis retailers via their point-of-sale systems, which are linked up with Headset’s business intelligence software. Headset’s data is very reliable, as it comes digitally direct from our partner retailers. However, the potential does exist for misreporting in the instance of duplicates, incorrectly classified products, inaccurate entry of products into point-of-sale systems, or even simple human error at the point of purchase. Thus, there is a slight margin of error to consider. Brands listed on this page are ranked in the top twenty within the market and product category by total retail sales volume.


