Mar-2025
Sales
Trend
6-Month
Product Count
SKUs
Overview
Market Insights Snapshot
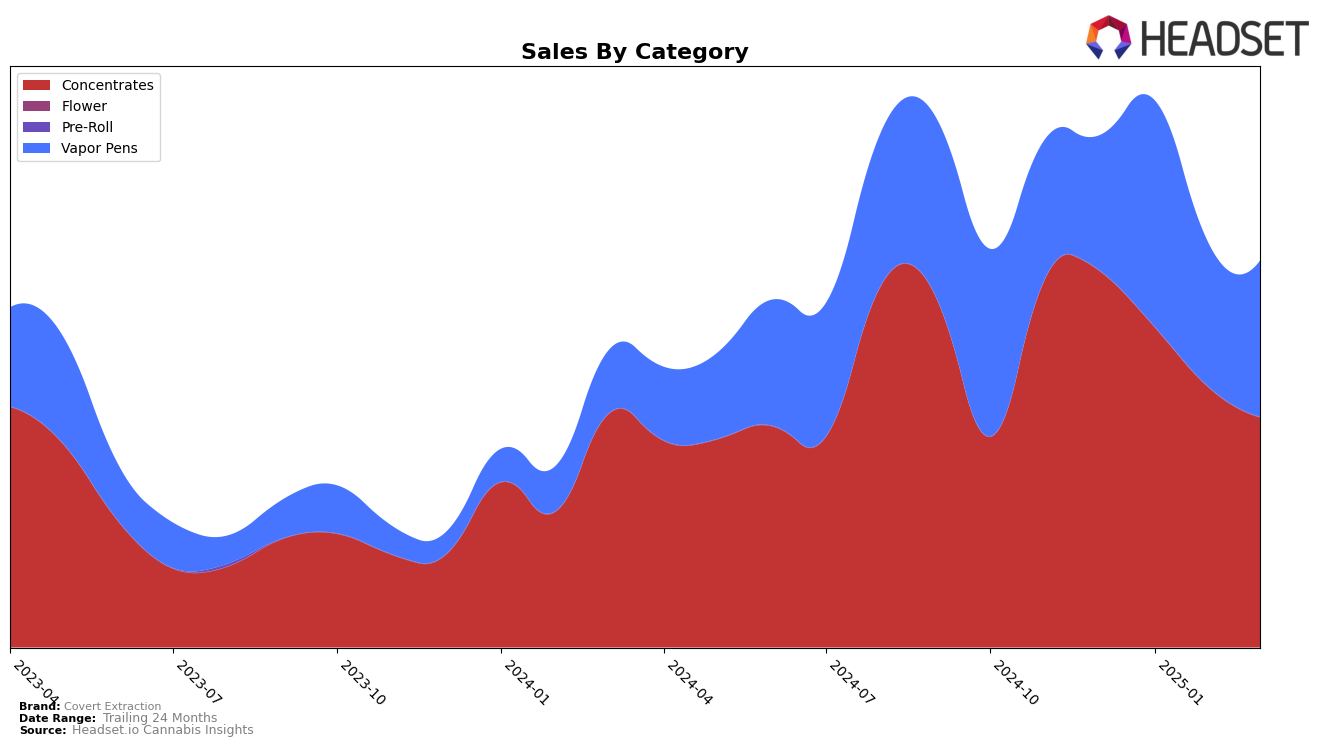
Covert Extraction's performance in the Missouri concentrates category has shown a gradual decline over the past few months. Starting from a rank of 11 in December 2024, the brand slid down to 17 by March 2025. This downward trend is reflected in the sales figures, which decreased from $229,856 in December to $112,859 in March. In contrast, their performance in the vapor pens category in Missouri has remained relatively stable, consistently ranking around the 50th position, indicating a potential challenge in gaining traction in this category.
In Oregon, Covert Extraction's performance in the concentrates category has been more volatile. After starting at 21st position in December, the brand saw a dip to 34th in February before recovering slightly to 24th in March. This fluctuation suggests a dynamic market environment, with Covert Extraction managing to regain some ground despite the initial setback. However, their ranking in the vapor pens category has not breached the top 60, suggesting limited market penetration and a need for strategic adjustments to improve their standing in this segment.
Competitive Landscape
In the Missouri concentrates market, Covert Extraction has experienced a notable decline in rank and sales from December 2024 to March 2025. Starting at 11th place in December, Covert Extraction has dropped to 17th by March, with sales decreasing significantly over this period. This downward trend contrasts with the performance of competitors such as Pinpoint, which, despite a dip in February, maintained a stronger position overall, ranking as high as 5th in January. Meanwhile, CAMP Cannabis showed an impressive upward trajectory, climbing from 28th in December to 15th in March, indicating a potential shift in consumer preferences. Smokey River Cannabis and Dark Horse Cannabis have also been fluctuating in the rankings, but their sales figures suggest they are not capturing market share as effectively as Covert Extraction's more successful competitors. These dynamics highlight the competitive pressures Covert Extraction faces and underscore the need for strategic adjustments to regain its market position.

Notable Products
In March 2025, Covert Extraction's top-performing product was New Speedway Boogie Badder (1g) in the Concentrates category, achieving the number one rank with sales figures hitting 1016 units. Following closely, Gelato 41 Crumble (1g) secured the second position, while Mint Cake Cured Resin (1g) maintained a solid third place. Bubba Kush Cured Resin (1g) and Green Crack Crumble (1g) completed the top five, ranking fourth and fifth respectively. Notably, these rankings represent a consistent performance for New Speedway Boogie Badder, which maintained its top spot from previous months, while Gelato 41 Crumble and Mint Cake Cured Resin have shown an upward trend, improving their ranks from February 2025. The steady performance of these products highlights their strong consumer demand and market presence in the Concentrates category.
Top Selling Cannabis Brands
Data for this report comes from real-time sales reporting by participating cannabis retailers via their point-of-sale systems, which are linked up with Headset’s business intelligence software. Headset’s data is very reliable, as it comes digitally direct from our partner retailers. However, the potential does exist for misreporting in the instance of duplicates, incorrectly classified products, inaccurate entry of products into point-of-sale systems, or even simple human error at the point of purchase. Thus, there is a slight margin of error to consider. Brands listed on this page are ranked in the top twenty within the market and product category by total retail sales volume.

