Mar-2025
Sales
Trend
6-Month
Product Count
SKUs
Overview
Market Insights Snapshot
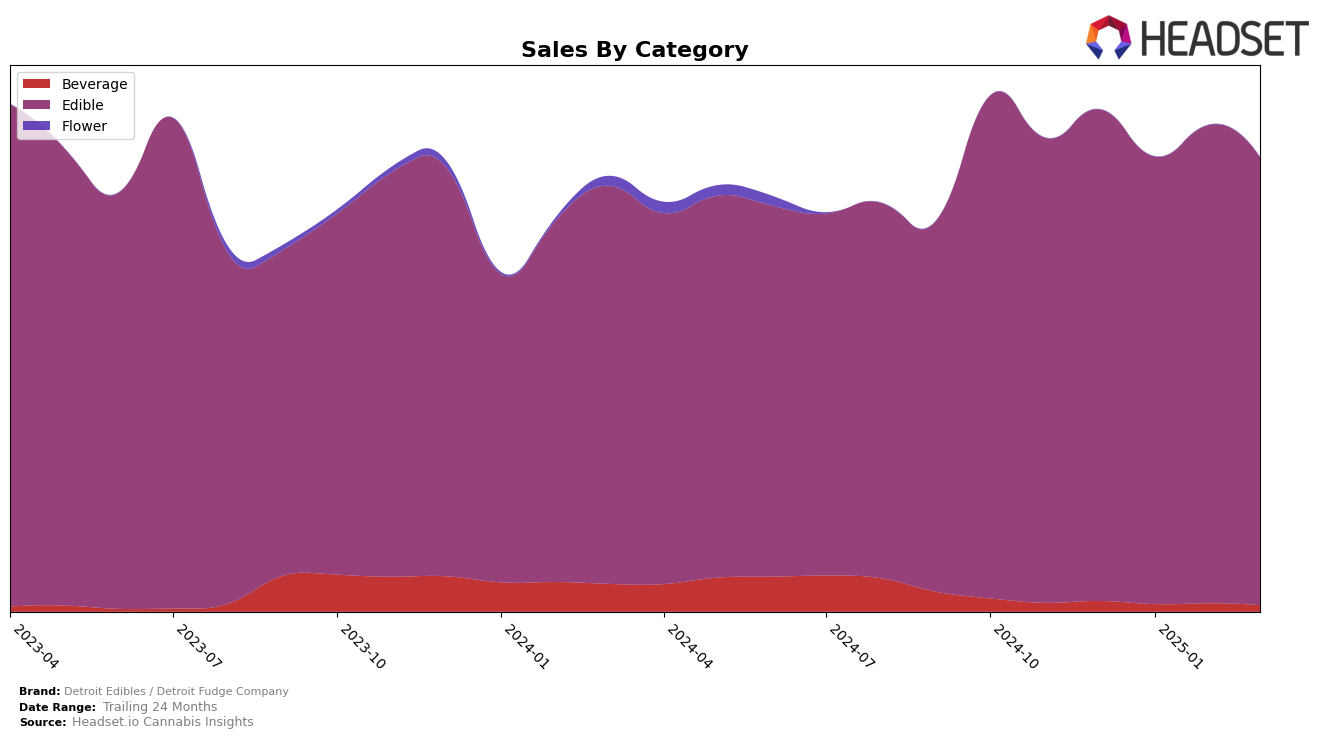
Detroit Edibles / Detroit Fudge Company has demonstrated a significant presence in the Michigan cannabis market, particularly in the Edible category. Over the months from December 2024 to March 2025, the brand maintained a steady ranking, starting at 8th place in December and January, briefly climbing to 7th in February before settling back to 10th in March. This consistent placement within the top 10 indicates a strong foothold in the market, although the slight dip in March could suggest increased competition or seasonal fluctuations in consumer preferences. Notably, the brand did not rank in the top 30 for the Beverage category after December, which might reflect a strategic focus on edibles or perhaps a need to innovate within the beverage segment.
In terms of sales, Detroit Edibles / Detroit Fudge Company experienced some fluctuations in their Edible category sales figures. Starting with a robust $778,803 in December, there was a dip in January, followed by a recovery in February, and another slight decline in March. Such variations could be indicative of promotional activities or changes in consumer demand. The absence of rankings in the Beverage category from January onwards suggests that the brand might be facing challenges in that segment or is prioritizing its resources towards the more successful Edible category. The data highlights the importance for brands to continuously adapt to market conditions and consumer trends to maintain and improve their standings.
Competitive Landscape
In the competitive landscape of the Michigan edible cannabis market, Detroit Edibles / Detroit Fudge Company has shown resilience and adaptability, maintaining a relatively stable position among its peers. As of March 2025, the brand ranks 10th, a slight dip from its peak at 7th in February 2025. This fluctuation indicates a competitive environment, with brands like Play Cannabis and Dixie Elixirs consistently performing well, with Play Cannabis holding a higher rank despite a downward trend from 5th in December 2024 to 9th in March 2025. Meanwhile, True North Collective has shown a significant improvement, climbing from 13th in February 2025 to 8th in March 2025, indicating a potential threat to Detroit Edibles' market share. Despite these challenges, Detroit Edibles / Detroit Fudge Company has maintained strong sales figures, suggesting a loyal customer base and effective marketing strategies that could be leveraged to regain higher rankings in the coming months.

Notable Products
In March 2025, the top-performing product from Detroit Edibles / Detroit Fudge Company was the Peanut Butter Milk High Dose Barracuda Chocolate Bar 20-Pack (200mg), maintaining its number one ranking consistently from December 2024 with a sales figure of 10,834 units. The Barracuda Crispy Milk Chocolate Bar 20-Pack (200mg) held steady at the second position throughout the same period. The Barracuda Death By Chocolate Cup 8-Pack (200mg) regained its third-place position after slipping to fourth in February 2025. The CBD/THC 1:1 High Dose Barracuda Milk Chocolate Bar 10-Pack (200mg CBD, 200mg THC) moved down to fourth place in March after briefly climbing to third in February. Finally, the Barracuda Milk Chocolate Bar (200mg), which did not rank in December 2024, re-entered the rankings in January and maintained the fifth position by March 2025.
Top Selling Cannabis Brands
Data for this report comes from real-time sales reporting by participating cannabis retailers via their point-of-sale systems, which are linked up with Headset’s business intelligence software. Headset’s data is very reliable, as it comes digitally direct from our partner retailers. However, the potential does exist for misreporting in the instance of duplicates, incorrectly classified products, inaccurate entry of products into point-of-sale systems, or even simple human error at the point of purchase. Thus, there is a slight margin of error to consider. Brands listed on this page are ranked in the top twenty within the market and product category by total retail sales volume.

