.svg)

Sep-2026
Sales
Trend
6-Month
Product Count
SKUs
Avg Price
YoY Sales Change
YoY Price Change


Where to Buy
Dixie Elixirs is stocked at 272 licensed dispensaries across Michigan, Maryland, and 5 other states, 134 of them in Michigan, with the deepest coverage in New Buffalo, Monroe, Detroit, Kalamazoo, and Traverse City. Search by ZIP code or city below to find the closest one, or filter by product type if you are after a specific format.
Market Insights Snapshot
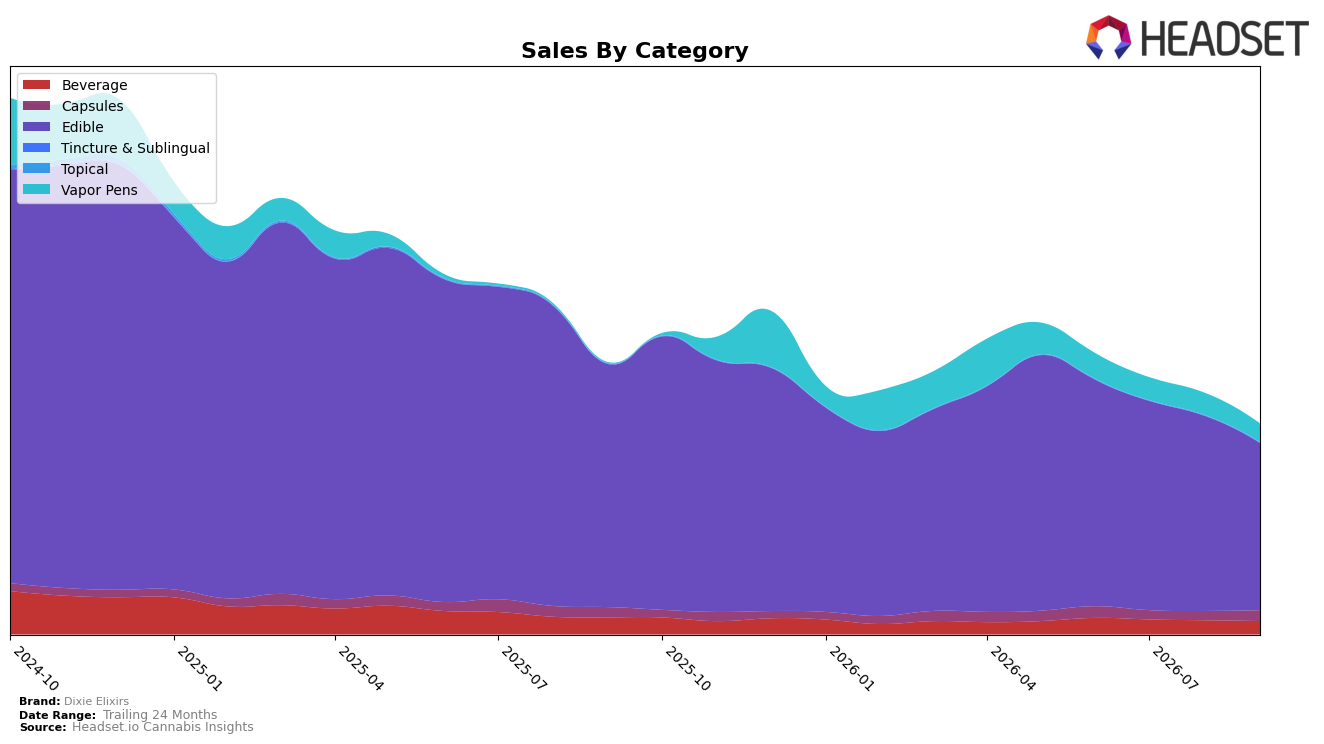
In September 2026, Dixie Elixirs concentrated 79.97% share in Edible, where sales fell 31.22% year over year and 14.32% month over month, while the brand’s overall sales declined 22.70% YoY and average price rose 3.01% YoY. Vapor Pens expanded to 8.78% of mix with a 3,199.80% YoY surge but slipped 16.23% MoM, suggesting a nascent line still stabilizing. Beverage held 6.27% share with sales down 21.82% YoY and 5.64% MoM, contrasting with Capsules at 4.98% share posting 5.48% YoY growth and 17.27% MoM growth. With Edible at rank 14 in Maryland and the top category under double‑digit MoM decline, the mix indicates reliance on a contracting core while smaller categories provide limited offset.
The pattern implies that Dixie Elixirs’s positioning hinges on defending Edible while cultivating Capsules as the only category with simultaneous YoY and MoM growth, a combination that can mitigate a 14‑place ceiling in Maryland Edibles. The 3,199.80% YoY spike in Vapor Pens alongside a 16.23% MoM pullback points to distribution or SKU resets rather than steady traction, whereas the 21.82% YoY decline and 5.64% MoM decline in Beverage signal limited headroom at an $8.33 average price versus $16.01 in Edible. Given Edible’s 79.97% mix and 31.22% YoY contraction, sustaining rank 14 will likely require reallocating mix toward Capsules’ 17.27% MoM momentum and stabilizing Vapor Pens to reduce exposure to a shrinking core.
Competitive Landscape
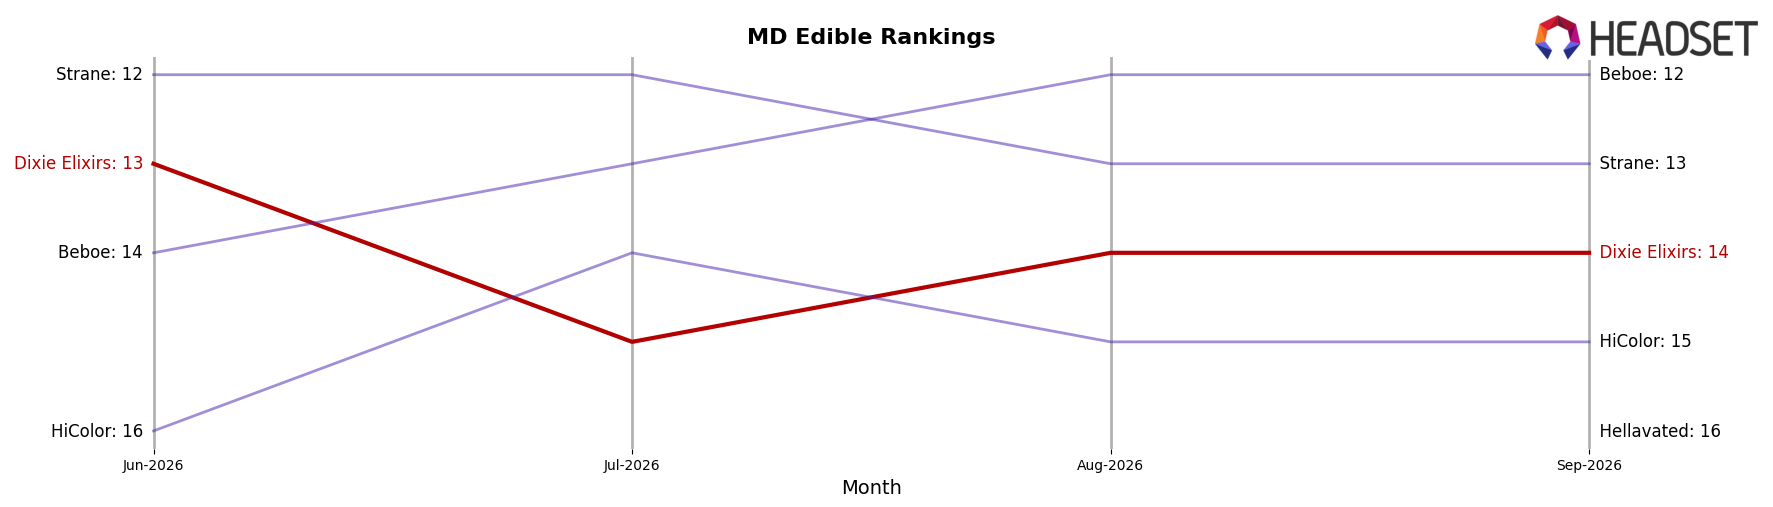
Dixie Elixirs sits at rank #14 in MD Edible for September 2026, improving 2 positions from #16 year over year, but slipping 1 spot from #13 in June 2026 when it marked its peak, indicating a near-plateau around the low‑teens. In the same period, Incredibles climbed from #5 to #1 with a 58% YoY sales increase, while Wyld fell from #1 to #4 alongside a 33% YoY sales decline, creating a top-tier reshuffle that Dixie Elixirs did not track despite a 2-rank YoY gain. This mix of upward pressure from rising leaders and volatility among incumbents implies Dixie Elixirs’ current #14 trajectory risks stagnation unless it converts low‑teens stability into share capture during periods when competitors rotate positions.
Notable Products
CBN/CBD/THC 2:1:1 Synergy Sleepberry Gummies 10-Pack (100mg CBN, 50mg CBD, 50mg THC) led the month with rank 1 but fell 47.6% month over month, while Indica Tropic Twist Gummies 10-Pack (100mg) dropped 12.2% to rank 6. In contrast, Berry Blaze Gummies 10-Pack (100mg) rose 13.3% to rank 2, and Sativa Citrus Blast Gummies 10-Pack (200mg) slid 14.3% to rank 5. With nine of the top ten coming from Edible SKUs and the lone Beverage entry at rank 9, the pattern implies a portfolio leaning into gummies where volatility at the top signals dependence on a few flagship formats rather than balanced category breadth.
Berry Blaze Gummies 20-Pack (200mg) edged down 3.4% to rank 3, whereas Sour Smash Gummies 10-Pack (200mg) gained 4.5% to rank 4. Indica Tropical Twist Gummies 10-Pack (200mg) declined 15.6% to rank 8, and Sour Strawberry Gummies 10-Pack (100mg) contracted 23.9% at rank 10. Given that multiple 100mg and 200mg gummy formats occupy ranks 1 through 8, the mix implies Dixie Elixirs is concentrating on core potency tiers where small share shifts can quickly reshuffle ranks and expose sensitivity to flavor and functional positioning.
Top Selling Cannabis Brands






Data for this report comes from real-time sales reporting by participating cannabis retailers via their point-of-sale systems, which are linked up with Headset’s business intelligence software. Headset’s data is very reliable, as it comes digitally direct from our partner retailers. However, the potential does exist for misreporting in the instance of duplicates, incorrectly classified products, inaccurate entry of products into point-of-sale systems, or even simple human error at the point of purchase. Thus, there is a slight margin of error to consider. Brands listed on this page are ranked in the top twenty within the market and product category by total retail sales volume.

