Mar-2025
Sales
Trend
6-Month
Product Count
SKUs
Overview
Market Insights Snapshot
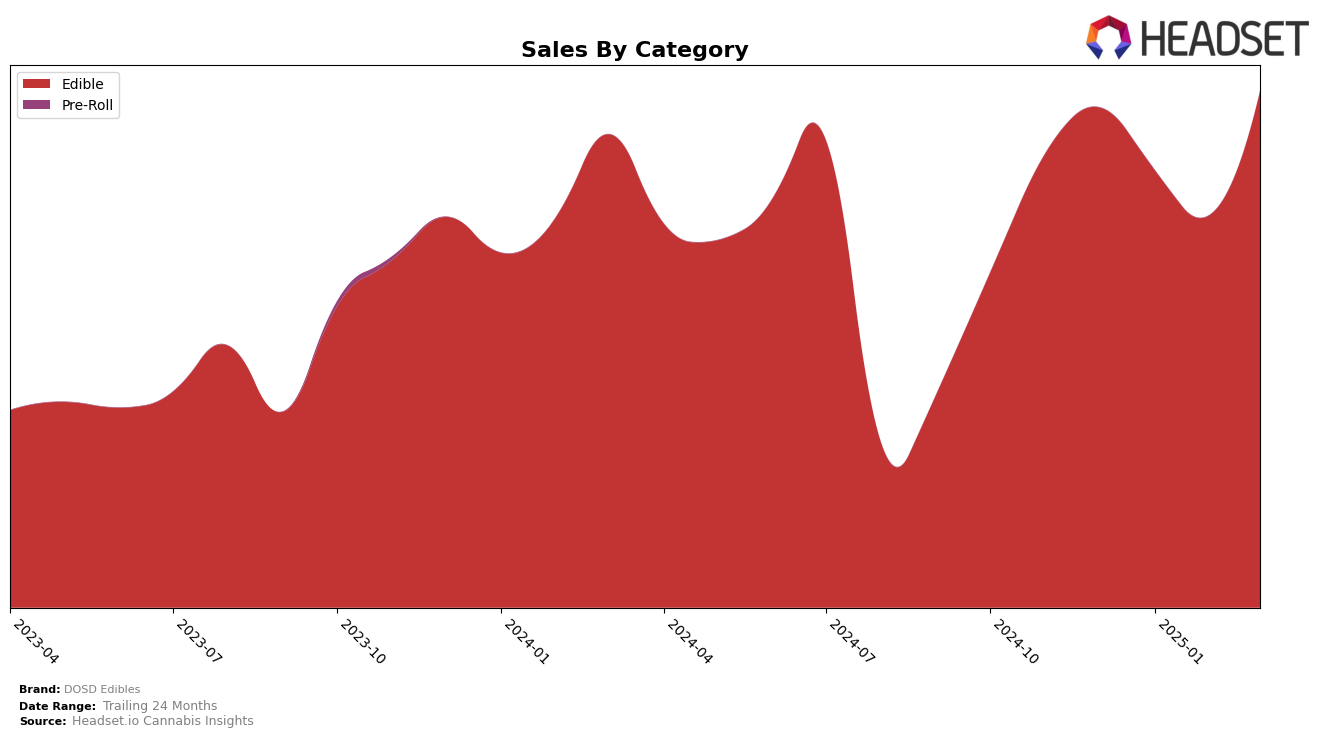
DOSD Edibles has shown varied performance across different states and categories, with notable movements in rankings over the months. In Colorado, the brand maintained a consistent presence in the top 20 for the edibles category, fluctuating slightly from 13th to 16th position between December 2024 and March 2025. Despite a dip in sales in February 2025, the brand rebounded in March with sales reaching approximately $163,898, suggesting resilience in this competitive market. The presence of DOSD Edibles in the top rankings highlights its established position, although the absence from the top 10 indicates room for growth in this state.
In Missouri, DOSD Edibles demonstrated a stronger upward trend, improving its rank from 13th in December 2024 to 10th by March 2025. This positive movement is accompanied by a substantial increase in sales, peaking in March 2025 at $480,160. The consistent climb in rankings and recovery in sales figures from a dip in January and February indicate a strengthening brand presence in Missouri's edibles market. The ability to break into the top 10 in Missouri underscores a successful strategy in this particular region, contrasting with their stable yet less dynamic performance in Colorado.
Competitive Landscape
In the Missouri edible cannabis market, DOSD Edibles has shown a promising upward trend in rankings over the past few months, moving from 13th place in December 2024 to 10th place by March 2025. This improvement in rank is significant, especially when compared to competitors such as Illicit / Illicit Gardens and Ostara Cannabis, which have maintained relatively stable positions, with Illicit consistently holding the 8th position and Ostara fluctuating slightly but remaining in the top 10. Notably, Tsunami experienced a drop from 7th to 11th place, indicating potential market volatility that DOSD Edibles has managed to navigate successfully. Despite a dip in sales during the early months of 2025, DOSD Edibles' March sales rebounded, suggesting effective strategies in place to capture market share. This resilience and upward momentum position DOSD Edibles as a strong contender in the Missouri edibles category, potentially appealing to consumers seeking reliable and popular cannabis products.

Notable Products
In March 2025, the top-performing product for DOSD Edibles was Nano Bites - Mixed Fruit Gummies 10-Pack (100mg), maintaining its consistent number one rank from previous months with sales reaching 7,245 units. Nano Bites Blue Raspberry Gummies (100mg) climbed back to the second position after dropping out of the rankings in February, showing a notable recovery. The Nano Bites - CBD:THC 1:1 Raspberry Gummies 10-Pack (100mg CBD, 100mg THC) dropped to the third position, while the Nano Bites - CBD/THC 1:1 Pina Colada Gummies 10-Pack (100mg CBD, 100mg THC) remained stable at fourth place. The Nano Bites - Cherry Cola Gummies 10-Pack (100mg) entered the top five for the first time, securing the fifth position with an increase in sales. Overall, the rankings indicate a dynamic shift in consumer preferences, with some products showing significant sales growth over the past months.
Top Selling Cannabis Brands
Data for this report comes from real-time sales reporting by participating cannabis retailers via their point-of-sale systems, which are linked up with Headset’s business intelligence software. Headset’s data is very reliable, as it comes digitally direct from our partner retailers. However, the potential does exist for misreporting in the instance of duplicates, incorrectly classified products, inaccurate entry of products into point-of-sale systems, or even simple human error at the point of purchase. Thus, there is a slight margin of error to consider. Brands listed on this page are ranked in the top twenty within the market and product category by total retail sales volume.

