Mar-2025
Sales
Trend
6-Month
Product Count
SKUs
Overview
Market Insights Snapshot
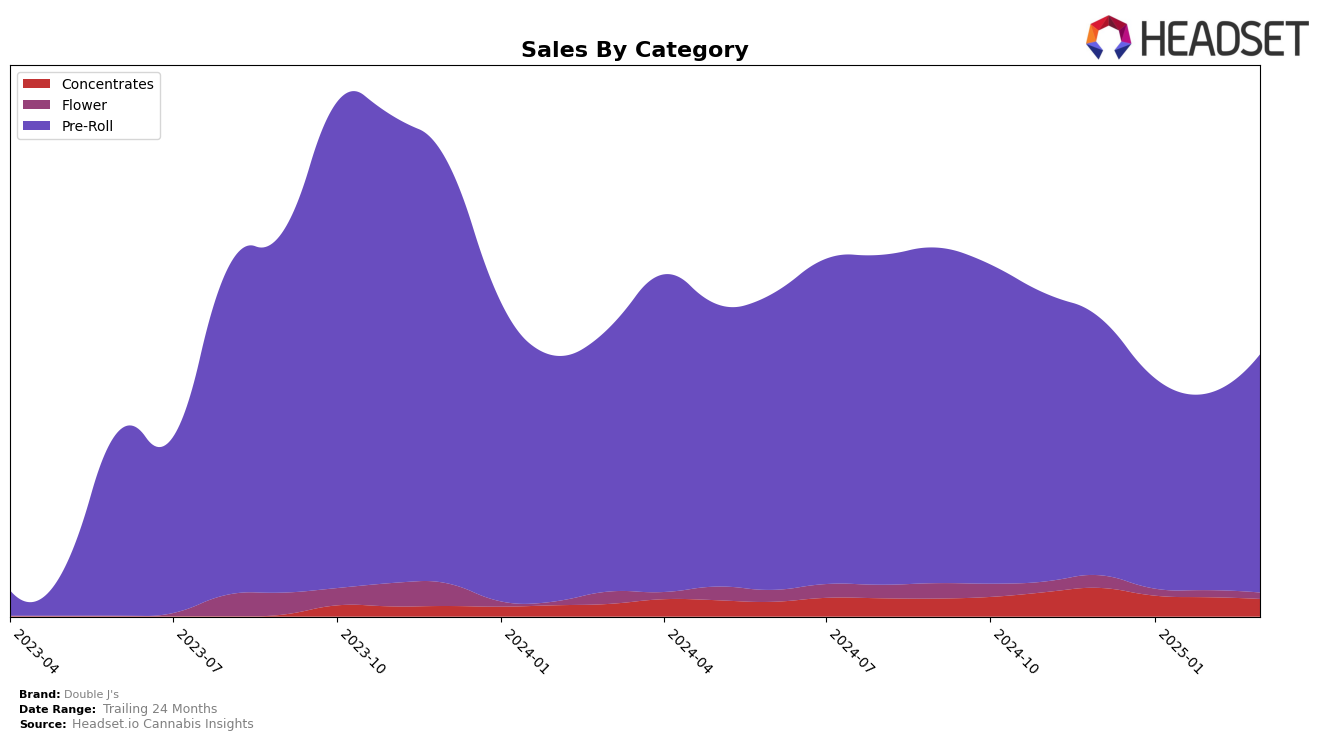
Double J's has shown varied performance across categories and states, with notable shifts in rankings over recent months. In the Ontario market, their presence in the Concentrates category has been relatively stable, maintaining a position just outside the top 30 for several months, with a slight improvement in February 2025 when they reached the 31st position. This upward trend, albeit minor, indicates a potential for growth in a competitive segment. However, the brand's sales figures in this category have seen a consistent decline from December 2024 through March 2025, suggesting challenges in maintaining consumer interest or facing increasing competition.
Conversely, Double J's has demonstrated more promising progress in the Pre-Roll category within Ontario. Starting in December 2024 at the 28th position, they have climbed to the 21st spot by March 2025, reflecting a stronger market presence and possibly a more effective strategy or product appeal in this category. Notably, their sales increased significantly in March 2025, reversing the downward trend observed in the previous months. This improvement in ranking and sales could suggest successful marketing efforts or product innovations that have resonated well with consumers, positioning Double J's as a brand to watch in the Pre-Roll segment in Ontario.
Competitive Landscape
In the competitive landscape of the Pre-Roll category in Ontario, Double J's has demonstrated a notable upward trajectory in brand ranking from December 2024 to March 2025. Starting at rank 28 in December, Double J's improved to rank 21 by March, indicating a positive trend in market positioning. This ascent is significant when compared to competitors like FIGR, which fluctuated between ranks 29 and 22, and Rizzlers, which climbed from rank 38 to 23, showing a similar upward trend but starting from a lower position. Meanwhile, Station House and BoxHot maintained relatively stable positions, with BoxHot consistently outperforming Station House. Despite these competitors, Double J's sales have shown resilience, particularly in March 2025, where sales figures rebounded to levels comparable with December 2024, suggesting effective market strategies and consumer retention efforts. This analysis underscores the dynamic nature of the Pre-Roll market in Ontario and highlights Double J's competitive edge in climbing the ranks amidst fluctuating market conditions.

Notable Products
In March 2025, Double J's top-performing product was Cherry Boat Pre-Roll 2-Pack (2g) in the Pre-Roll category, maintaining its first-place rank from previous months with sales of 18,706 units. Following closely, TK3k Pre-Roll 2-Pack (2g) held steady at the second position, showing consistent performance over the months. Star Cab Cherry Chem Pre-Roll 4-Pack (4g) remained in the third spot, indicating stable demand despite a dip in sales earlier in the year. Pink Sour Pre-Roll 2-Pack (2g) showed a notable improvement in sales, although it retained its fourth rank from February. Sungrown Traditional Hash (2g) in the Concentrates category continued to rank fifth, with a gradual decline in sales figures over the months.
Top Selling Cannabis Brands
Data for this report comes from real-time sales reporting by participating cannabis retailers via their point-of-sale systems, which are linked up with Headset’s business intelligence software. Headset’s data is very reliable, as it comes digitally direct from our partner retailers. However, the potential does exist for misreporting in the instance of duplicates, incorrectly classified products, inaccurate entry of products into point-of-sale systems, or even simple human error at the point of purchase. Thus, there is a slight margin of error to consider. Brands listed on this page are ranked in the top twenty within the market and product category by total retail sales volume.

