Jan-2025
Sales
Trend
6-Month
Product Count
SKUs
Overview
Market Insights Snapshot
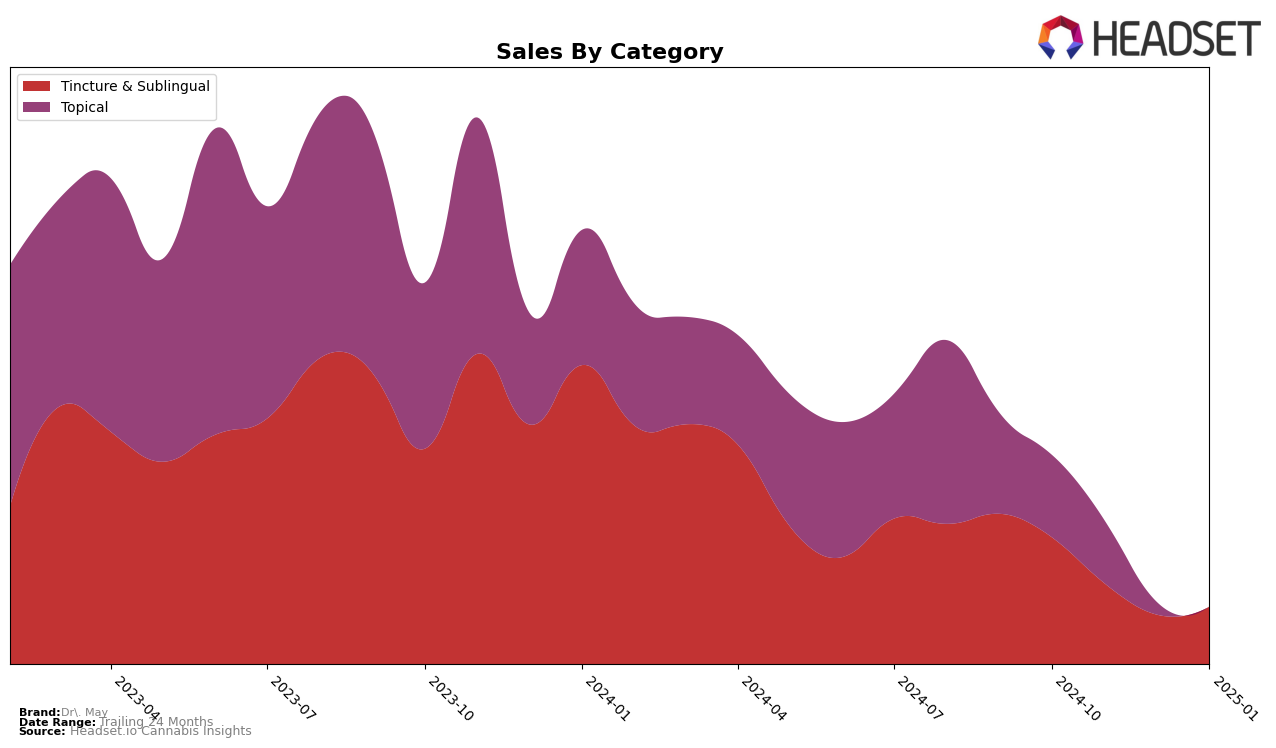
Dr. May's performance in the California market showcases some interesting trends across the Tincture & Sublingual and Topical categories. In the Tincture & Sublingual category, Dr. May experienced a slight decline in their rankings from 16th in October 2024 to 19th by January 2025. This downward trend is accompanied by a notable decrease in sales, suggesting potential challenges in maintaining market share. Conversely, in the Topical category, Dr. May maintained a steady position at 12th place for both October and November 2024. However, the absence of rankings in December 2024 and January 2025 indicates that Dr. May did not make it into the top 30 brands, which could be a point of concern for the brand's presence in this category.
The fluctuations in Dr. May's rankings highlight the competitive nature of the cannabis market in California. The decline in the Tincture & Sublingual category suggests a need for strategic adjustments to regain momentum. Meanwhile, the consistent ranking in the Topical category, despite not being listed in the top 30 towards the end of the period, implies a potential for growth if the brand can address the factors contributing to this drop. These movements emphasize the importance of adaptability and continuous market analysis for Dr. May to enhance their position across different categories.
Competitive Landscape
In the competitive landscape of the Tincture & Sublingual category in California, Dr. May has experienced a notable decline in rank from October 2024 to January 2025, moving from 16th to 19th position. This downward trend in rank is mirrored by a decrease in sales over the same period. In contrast, Carter's Aromatherapy Designs (C.A.D.) has maintained a consistent 13th rank, with a significant increase in sales, indicating strong market performance and possibly capturing some of Dr. May's market share. Meanwhile, My Blue Dove has shown stability in its 18th position, suggesting a steady consumer base despite a slight sales fluctuation. Brands like High Gorgeous by Yummi Karma and Kind Medicine have not appeared in the top 20 rankings, indicating lesser competitive pressure from these brands. For Dr. May, this competitive analysis highlights the need to address declining sales and ranking to regain its competitive edge in the California market.

Notable Products
In January 2025, Dr. May's top-performing product was the CBD/THC 1:1 Balance 350 Formula Tincture, which achieved the number one rank with sales of 114 units. The CBD/THC 20:1 Focus 1000 Tincture held the second position, showing a slight improvement from its third-place rank in December 2024. The CBD/THC 1:20 Relax 1000 Formula Tincture, previously ranked first in December, dropped to third place. The CBD/THC 1:20 Relax Twist Up Balm remained consistent, maintaining its fourth-place position for two consecutive months. Finally, the CBD/THC 1:1 Balance Twist-Up Topical Balm rounded out the top five, having re-entered the rankings after being unranked in December 2024.
Top Selling Cannabis Brands
Data for this report comes from real-time sales reporting by participating cannabis retailers via their point-of-sale systems, which are linked up with Headset’s business intelligence software. Headset’s data is very reliable, as it comes digitally direct from our partner retailers. However, the potential does exist for misreporting in the instance of duplicates, incorrectly classified products, inaccurate entry of products into point-of-sale systems, or even simple human error at the point of purchase. Thus, there is a slight margin of error to consider. Brands listed on this page are ranked in the top twenty within the market and product category by total retail sales volume.


