Jun-2026
Sales
Trend
6-Month
Product Count
SKUs
Avg Price
YoY Sales Change
YoY Price Change
Market Insights Snapshot
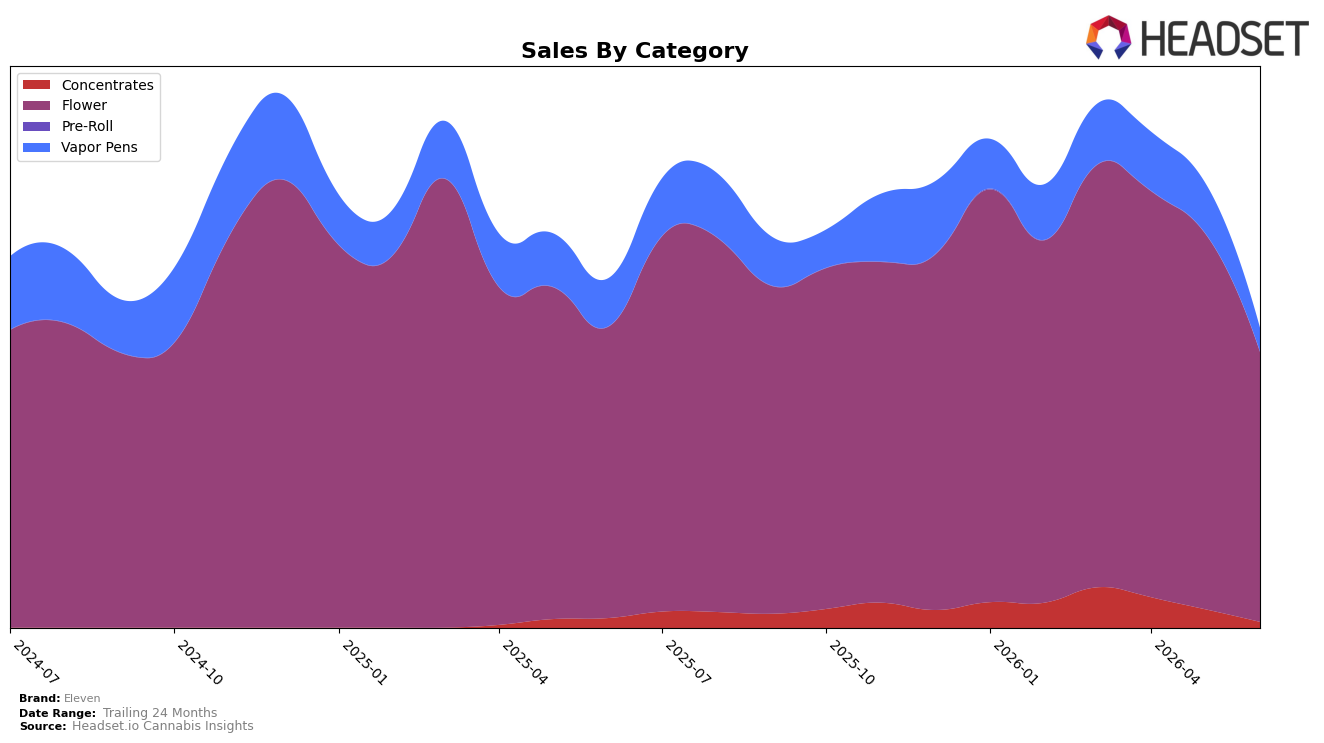
Eleven’s mix in June 2026 is heavily concentrated in Flower at 90.22% share, with Vapor Pens at 7.85% and Concentrates at 1.92%, and the concentration intensified as Flower fell 28.30% month over month versus Vapor Pens down 53.25% and Concentrates down 68.94%. Year over year, Flower declined 7.33% while Vapor Pens dropped 50.88% and Concentrates fell 40.09%, indicating the brand’s portfolio is contracting fastest in the smaller categories while the largest category erodes more slowly; coupled with an 11.81% average price increase and a -14.21% brand sales change, this pattern implies a defensive tilt toward Flower volume retention despite price inflation.
Within Flower, Eleven holds rank 19 in Massachusetts, and with Flower’s 90.22% share and a -28.30% month-over-month sales change alongside a -7.33% year-over-year decline, the brand is positioned as a mid-pack Flower specialist rather than a diversified player. Given Vapor Pens’ 7.85% share with a -53.25% month-over-month drop and Concentrates’ 1.92% share with a -68.94% month-over-month decline while average prices rose 11.81%, the implied positioning is price-led premiumization in core Flower and de-emphasis of peripheral formats, which narrows the addressable base but can consolidate rank 19 in Massachusetts if execution supports repeat Flower buyers.
Competitive Landscape
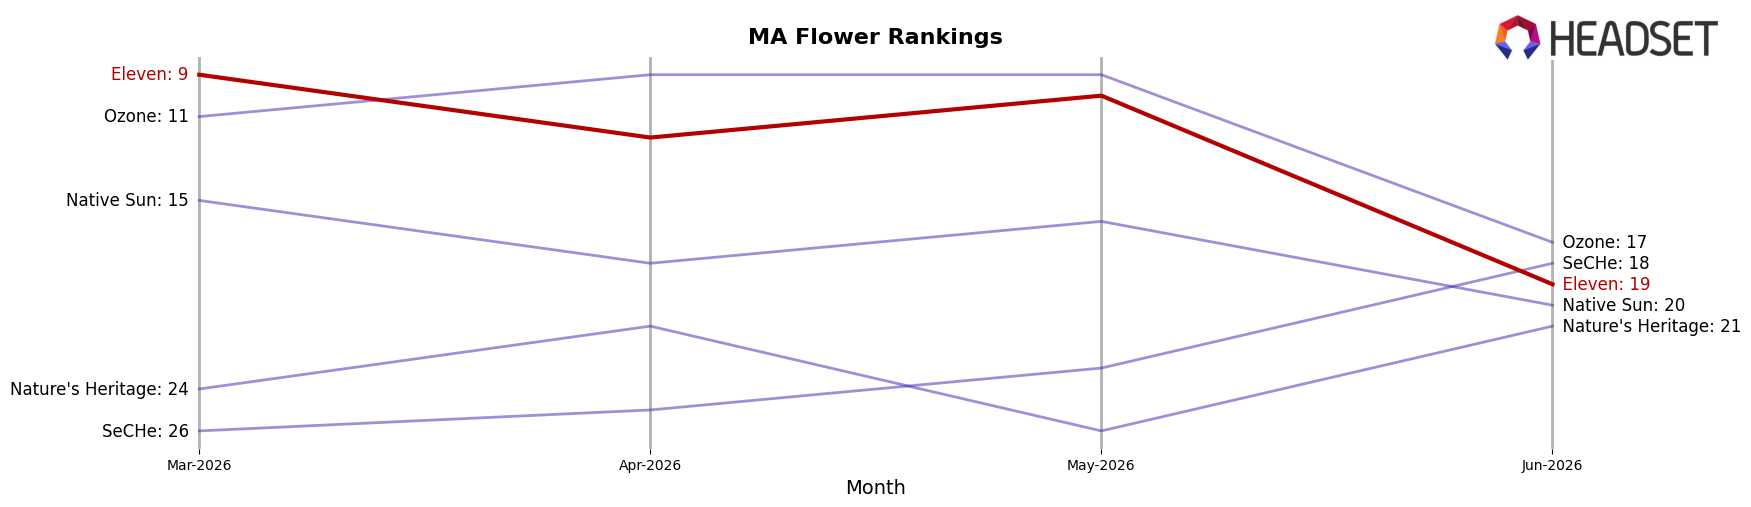
Eleven sits at rank #19 in Massachusetts Flower for June 2026, unchanged YoY from #19, but down 10 positions from #9 in March 2026 and 12 positions from its peak of #7 in March 2025; meanwhile, Farmer's Cut climbed from #3 YoY to #1 and expanded sales by 32.4%, and Root & Bloom moved from #16 YoY to #5 with 158.9% sales growth, indicating top-tier rivals are accelerating upward while Eleven is losing relative placement. With Simply Herb slipping from #1 to #2 despite only a 1.6% sales decline and High Supply / Supply improving from #5 to #4 on 16.7% growth, the competitive set is tightening at the top as Eleven holds flat YoY but drops 10 ranks quarter-on-quarter; the pattern implies Eleven’s share is being compressed by faster risers and that maintaining #19 YoY masks recent momentum loss.
Notable Products
Rainbow Guava (7g) posted the steepest decline in June 2026, falling 34.98% to rank 5, while Champagne Cookies (7g) slid 26.92% to rank 4, and Blue Runtz (14g) dropped 11.96% at rank 6. In contrast, Blue Runtz (7g) rose 46.06% to rank 3, narrowing the gap to Strawberry Guava (7g) at rank 1 and Dulce De Uva (7g) at rank 2, indicating a rotation within the top tier rather than a category exit. With all top ten SKUs in Flower and three of the top five experiencing double-digit declines, concentration risk is elevated even as a single gainer offsets some volume, with Strawberry Guava (7g) anchoring the lineup at $54,764. The pattern implies Eleven is consolidating around Flower with volatility skewed toward flavor variants, suggesting the commercial direction favors depth in a few flagship strains over breadth across categories.
Top Selling Cannabis Brands
Data for this report comes from real-time sales reporting by participating cannabis retailers via their point-of-sale systems, which are linked up with Headset’s business intelligence software. Headset’s data is very reliable, as it comes digitally direct from our partner retailers. However, the potential does exist for misreporting in the instance of duplicates, incorrectly classified products, inaccurate entry of products into point-of-sale systems, or even simple human error at the point of purchase. Thus, there is a slight margin of error to consider. Brands listed on this page are ranked in the top twenty within the market and product category by total retail sales volume.

