Jun-2026
Sales
Trend
6-Month
Product Count
SKUs
Avg Price
YoY Sales Change
YoY Price Change
Market Insights Snapshot
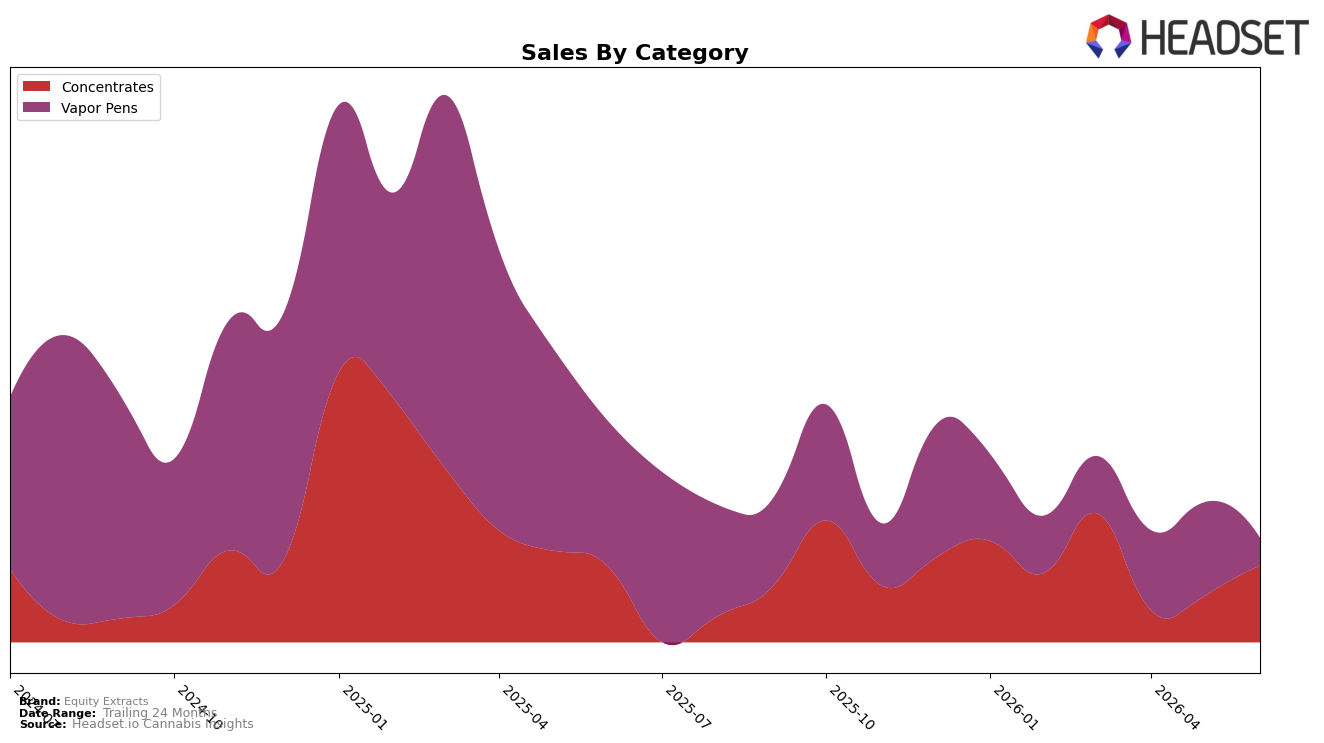
In June 2026, Equity Extracts concentrated its revenue mix in Concentrates at 67.79% share (ranked 19 in Concentrates in Maryland), while Vapor Pens fell to 32.21% share. Concentrates posted +1.29% year-over-year and +48.17% month-over-month, contrasting with Vapor Pens at -72.65% year-over-year and -59.81% month-over-month. Despite a brand-level sales decline of -45.86% year-over-year, the month-over-month surge in Concentrates against the contraction in Vapor Pens indicates a pivot back to the core extraction segment at a lower average price (-9.13% year-over-year) to regain volume.
The mix shift implies Equity Extracts is positioning around Concentrates momentum rather than defending Vapor Pens, leaning into a category where June 2026 rank 19 in Maryland offers clearer traction. With Concentrates expanding +48.17% month-over-month while Vapor Pens contracted -59.81% month-over-month, the cross-category elasticity suggests price-accessible extracts (Concentrates average price $25.54 vs. Vapor Pens $29.40) are driving substitution at the basket level. The implication is to prioritize Concentrates assortment and pricing architecture to convert share volatility into sustained rank improvement and mitigate the 24-month sales decline of -42.49%.
Competitive Landscape
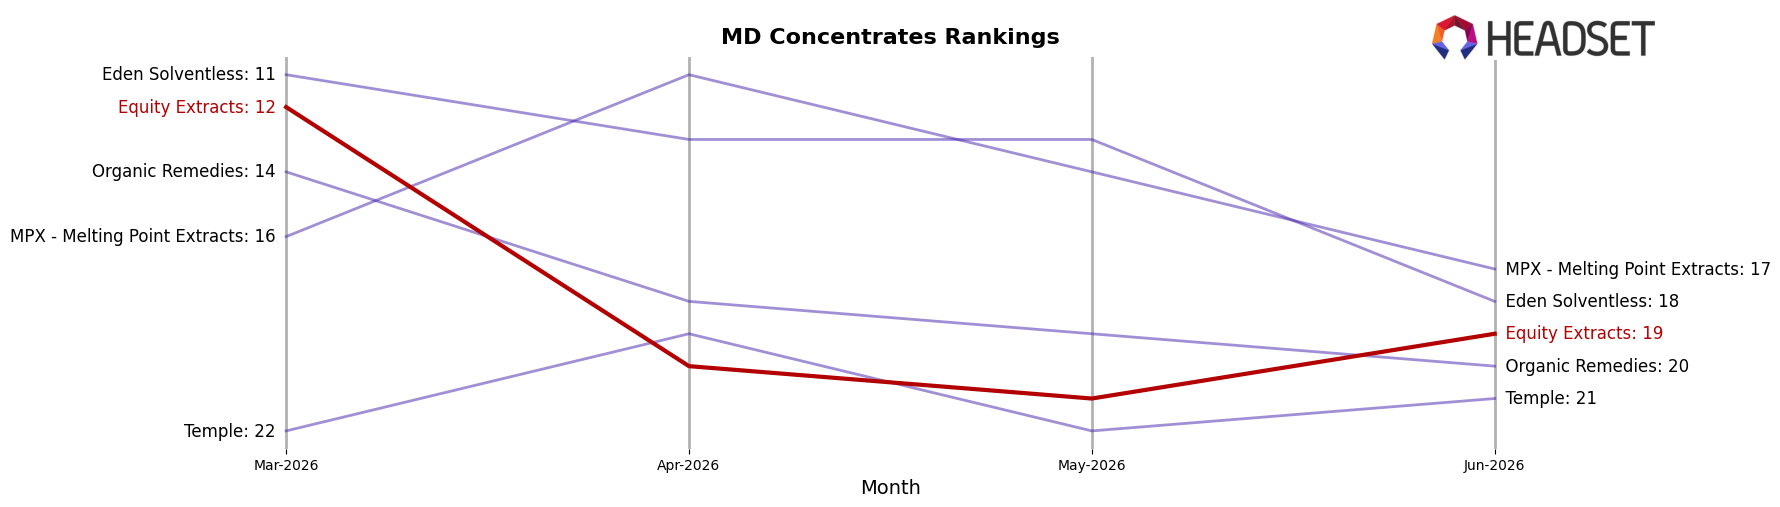
Equity Extracts sits at rank 19 in June 2026 in MD Concentrates, down 2 positions year over year from rank 17, and 7 positions lower than its March 2026 rank of 12, while also trailing its January 2025 peak of 9 by 10 positions; in contrast, Evermore Cannabis Company improved 1 rank year over year from 4 to 3 with a 23.17% sales increase and Beezle Extracts climbed from rank 6 to 4 alongside a 22.72% sales gain, signaling that rivals are converting mid-pack momentum into sustained placement as Equity Extracts relinquishes share of voice within the top 15—implying the current rank trajectory points to continued mid-to-low tier positioning unless recent declines reverse.
Notable Products
Patapeake Shortbread Shatter (1g) delivered the standout move with a +169.5% month-over-month surge, vaulting into rank 3 in June 2026, while Thai Ger King Shatter (1g) collapsed -90.5% MoM to rank 10; this split implies rapid reallocation of demand toward a few winning SKUs and away from laggards. With Ice Cream Cake Shatter (1g) holding rank 1 and Huckleberry Soda Shatter (1g) at rank 2, five of the top ten are Concentrates, indicating category concentration that may be crowding out mid-pack Vapor Pens at ranks 7–9. The top-three stacking in Concentrates alongside a -90.5% tail event at rank 10 signals a barbell mix that favors scaling proven shatter strains while pruning underperformers, pointing to a tighter, potency-led assortment strategy.
Top Selling Cannabis Brands
Data for this report comes from real-time sales reporting by participating cannabis retailers via their point-of-sale systems, which are linked up with Headset’s business intelligence software. Headset’s data is very reliable, as it comes digitally direct from our partner retailers. However, the potential does exist for misreporting in the instance of duplicates, incorrectly classified products, inaccurate entry of products into point-of-sale systems, or even simple human error at the point of purchase. Thus, there is a slight margin of error to consider. Brands listed on this page are ranked in the top twenty within the market and product category by total retail sales volume.

