Market Insights Snapshot
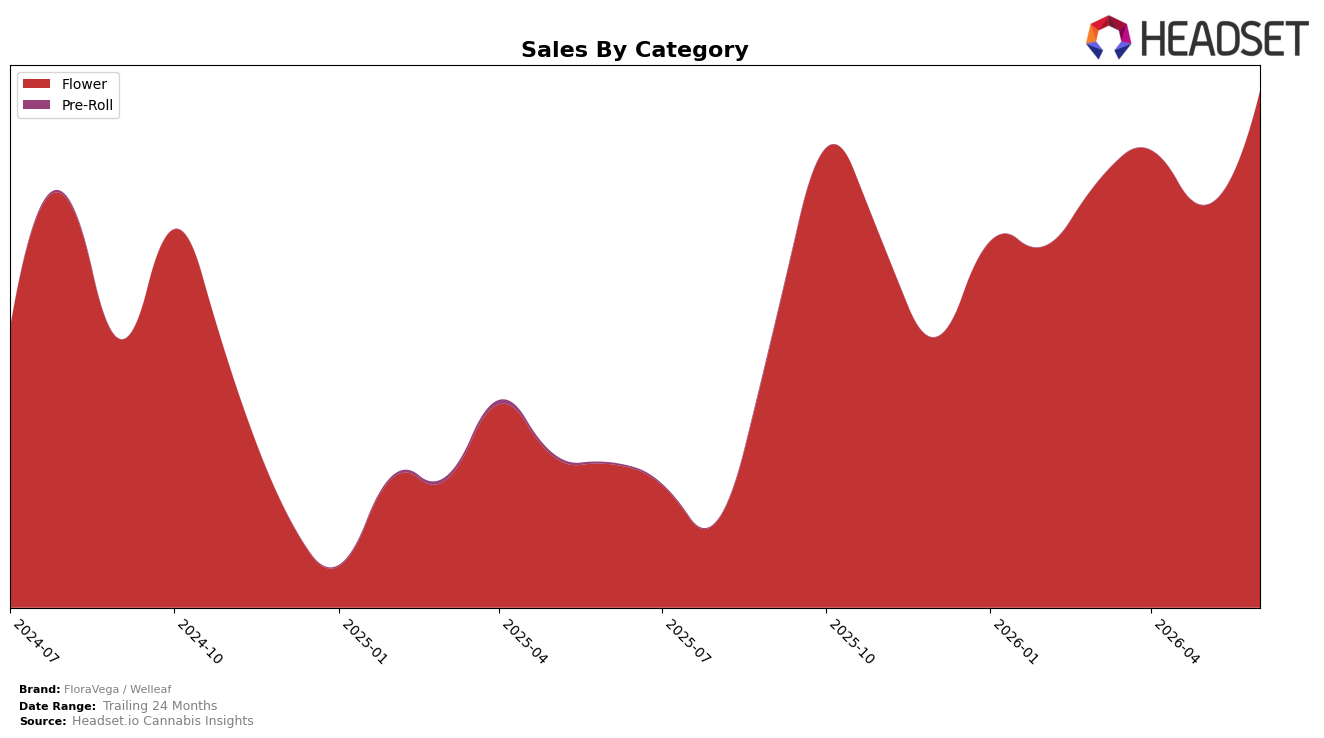
In June 2026, FloraVega / Welleaf’s mix was concentrated entirely in Flower at 100.0% share, with category sales up 260.35% year over year and 28.39% month over month; the brand’s overall sales growth of 256.72% year over year tracked closely to the category-specific surge, while average price was down 25.71% versus a year ago. With a category rank of 3 in Nevada Flower and a month-over-month lift of 28.39% on top of the year-over-year increase, the pattern implies a volume-led expansion inside a single-category footprint rather than diversification.
The full reliance on Flower at 100.0% share, combined with a 25.71% year-over-year price decline and a 28.39% month-over-month sales rise, indicates that market share gains are being pursued through price-accessible formats and greater unit throughput. Holding the number 3 rank in Nevada Flower while prices reset suggests the positioning is skewing toward scale and basket conversion within Flower, implying that near-term growth will depend on sustaining volume elasticity rather than cross-category expansion.
Competitive Landscape
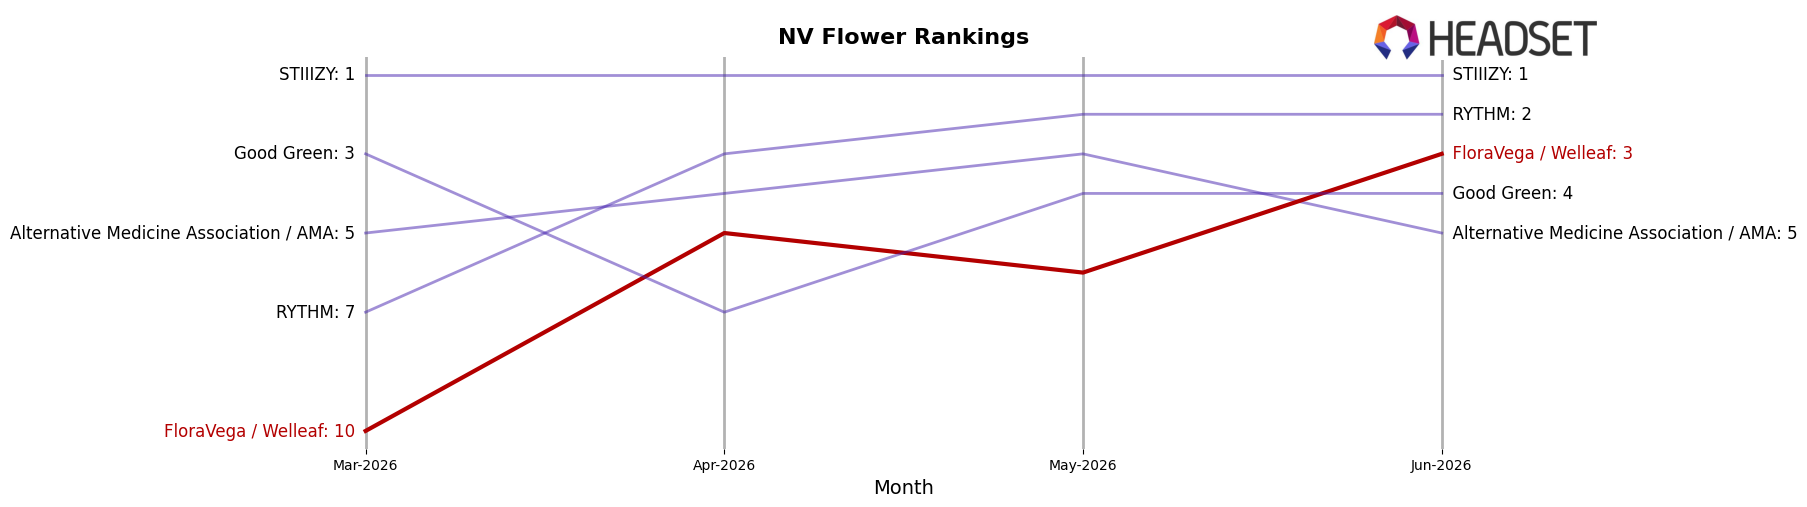
FloraVega / Welleaf is ranked #3 in NV Flower in June 2026, a climb of 19 positions from #22 year over year and a 7-position rise from #10 in March 2026, marking a new peak rank at #3 in June 2026. Against peers, STIIIZY held #1 with a 0-position YoY change while growing sales by 5.2%, and RYTHM sits at #2 after slipping 2 spots from #4 YoY with sales down 6.9%, whereas Good Green is #4 after a 1-position rise but with sales contracting 22.0%. The contrast with Alternative Medicine Association / AMA at #5 (down 2 spots YoY and −34.8% in sales) indicates that FloraVega / Welleaf’s upward rank trajectory is gaining from competitors’ share leakage and positioning it to challenge the stable #1–#2 tier.
Notable Products
Grape 98 (3.5g) posted the largest month-over-month gain at +76.6% and holds rank 1, while Garlic Haze (3.5g) plunged -64.6% to rank 6, setting a sharp divergence at the top of the June 2026 lineup. Mai Tai (3.5g) rose +17.4% to rank 2, and Typhoon #8 (3.5g) fell -19.7% to rank 10, with Strawberry Lemonade (3.5g) also down -11.7% at rank 7. Eight of the top ten are Flower SKUs, and Ice Cream Mintz (14g) anchors the large-format tier with $103,321 at rank 5, implying a pivot toward a Flower-heavy mix where a single high-velocity eighth can offset steep losses in lagging strains.
Top Selling Cannabis Brands
Data for this report comes from real-time sales reporting by participating cannabis retailers via their point-of-sale systems, which are linked up with Headset’s business intelligence software. Headset’s data is very reliable, as it comes digitally direct from our partner retailers. However, the potential does exist for misreporting in the instance of duplicates, incorrectly classified products, inaccurate entry of products into point-of-sale systems, or even simple human error at the point of purchase. Thus, there is a slight margin of error to consider. Brands listed on this page are ranked in the top twenty within the market and product category by total retail sales volume.

