Mar-2025
Sales
Trend
6-Month
Product Count
SKUs
Overview
Market Insights Snapshot
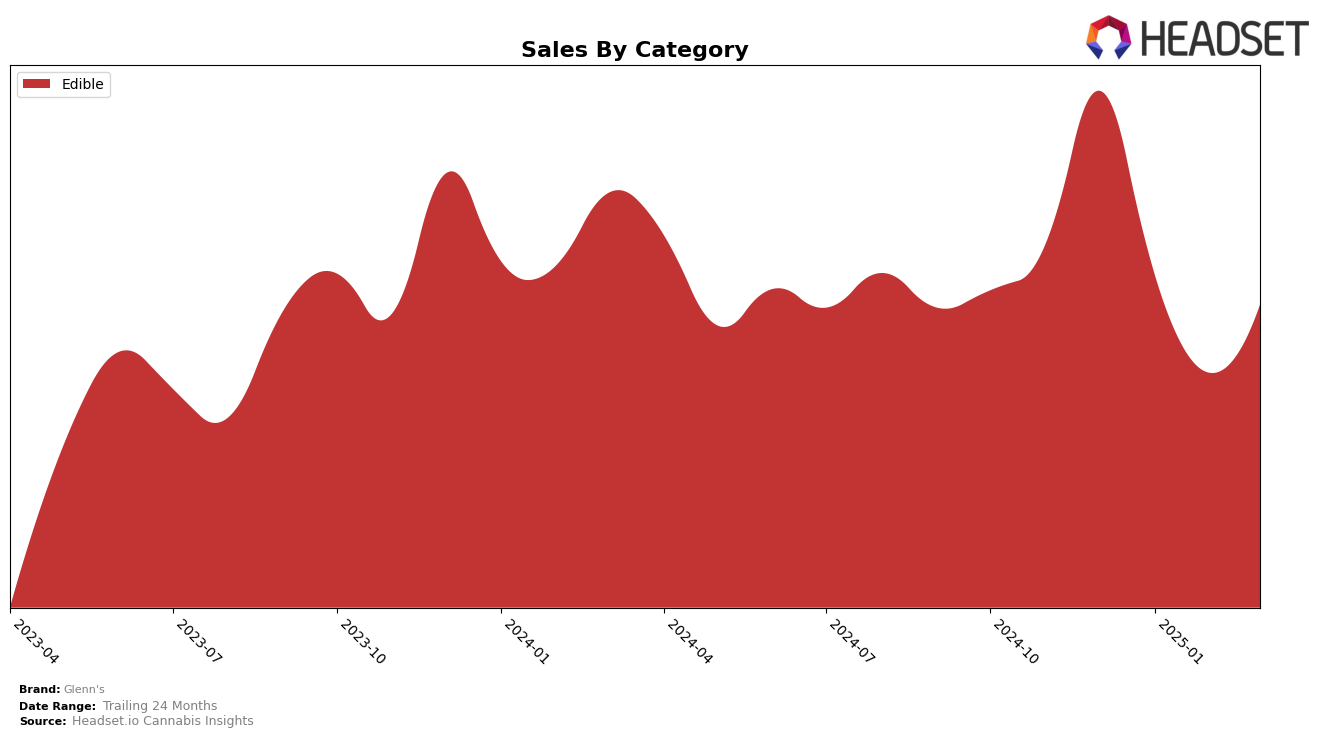
Glenn's has shown a consistent presence in the edible category in Ontario, maintaining a steady 17th rank from December 2024 through March 2025. This stability in ranking suggests a strong foothold in the market, despite a notable fluctuation in sales figures. The sales peaked in December 2024 and experienced a dip in February 2025 before recovering slightly in March 2025. This trend indicates potential seasonality or market dynamics affecting consumer purchasing behavior, which could be worth exploring further to understand the underlying causes.
While Glenn's maintains a stable ranking in Ontario's edibles category, the absence of rankings in other states or categories suggests that the brand has yet to establish a significant presence elsewhere. This could be interpreted as a potential area for growth or a strategic focus on specific markets. The lack of top 30 rankings in other regions might be seen as a challenge for Glenn's, but it also presents an opportunity for the brand to expand its reach and diversify its market presence. Understanding the brand's strategy and execution in Ontario could provide insights into how it might replicate success in other areas.
Competitive Landscape
In the Ontario edible cannabis market, Glenn's has maintained a consistent rank of 17th from December 2024 through March 2025, indicating a stable position amidst fluctuating sales figures. Despite a dip in sales from December to February, Glenn's experienced a rebound in March, suggesting potential resilience or effective marketing strategies. In contrast, Fly North saw a decline in rank from 12th to 15th, although their sales remained higher than Glenn's throughout the period. Meanwhile, Aurora Drift consistently held the 16th position, with sales figures that were notably higher than Glenn's, indicating a strong competitive edge. San Rafael '71 and Lord Jones maintained their positions at 18th and 20th, respectively, with sales figures lower than Glenn's, highlighting Glenn's competitive standing in the mid-tier segment of the market.

Notable Products
In March 2025, the top-performing product for Glenn's was Strawberry Watermelon Hash Rosin Gummies (10mg), maintaining its first-place rank from February, with sales reaching 2,859. Cotton Candy Gummies (10mg) held steady in the second position, consistent with its February ranking. Orange Creamsicle Hash Rosin Chews 2-Pack (10mg) also remained unchanged, securing the third spot for the month. Multi-Flavours Gummies 4-Pack (10mg) rose to fourth place, showing stability after ranking the same in February. Notably, the CBD:CBG:CBN:THC Lights Out Gummies (60mg CBN, 30mg CBD, 30mg CBG, 10mg THC) reappeared in the rankings at fifth place, marking a return after a previous absence in February.
Top Selling Cannabis Brands
Data for this report comes from real-time sales reporting by participating cannabis retailers via their point-of-sale systems, which are linked up with Headset’s business intelligence software. Headset’s data is very reliable, as it comes digitally direct from our partner retailers. However, the potential does exist for misreporting in the instance of duplicates, incorrectly classified products, inaccurate entry of products into point-of-sale systems, or even simple human error at the point of purchase. Thus, there is a slight margin of error to consider. Brands listed on this page are ranked in the top twenty within the market and product category by total retail sales volume.

