.svg)

Sep-2026
Sales
Trend
6-Month
Product Count
SKUs
Avg Price
YoY Sales Change
YoY Price Change


Where to Buy
Good Tide is stocked at 2,447 licensed dispensaries across California, Michigan, and 11 other states, 549 of them in California, with the deepest coverage in Los Angeles, Sacramento, San Francisco, San Diego, and Santa Ana. Search by ZIP code or city below to find the closest one.
Market Insights Snapshot
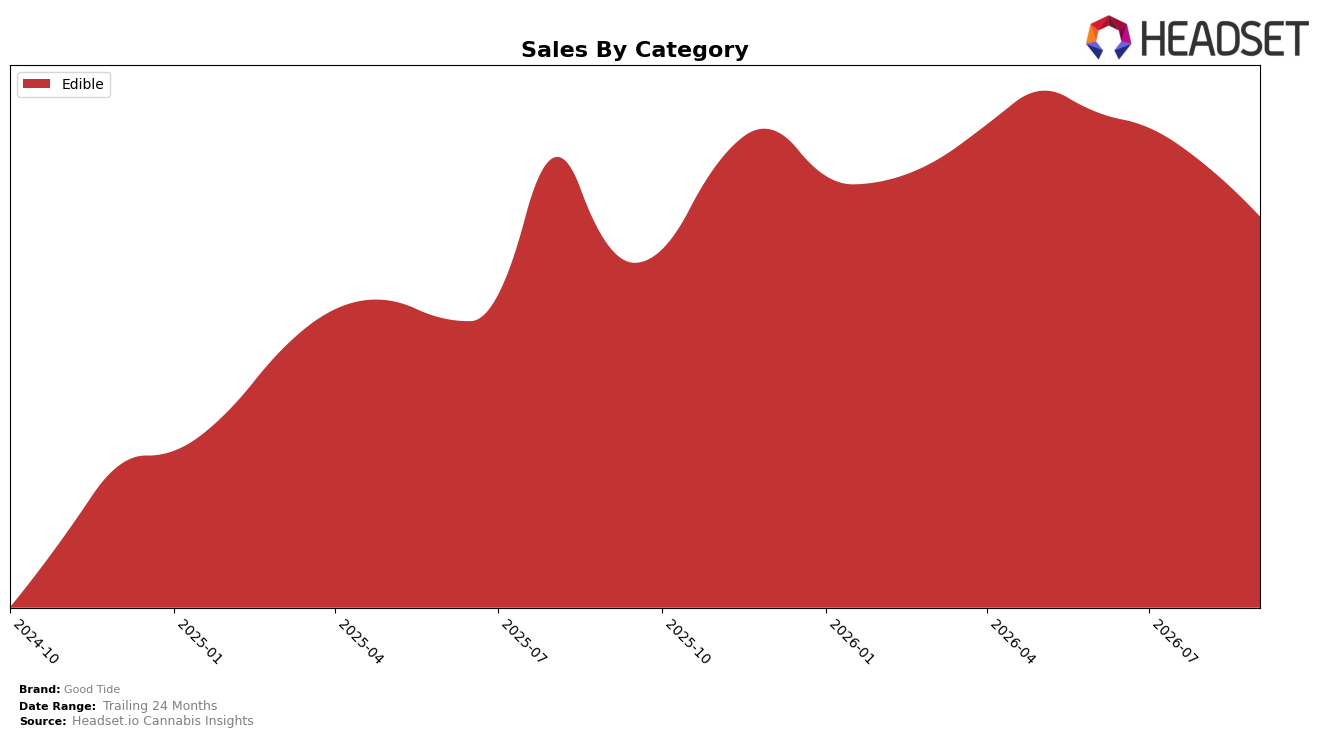
Good Tide operated as a single-category brand in September 2026, with Edible accounting for 100.0% of sales and an average price of $18.16. Within Edibles, year-over-year sales rose 3.33% while month-over-month declined 5.52%, and average price increased 1.64% YoY alongside a 24-month sales expansion of 90.58%. With CA as the top market and an Edible state rank of 4 in Oregon, the mix concentration suggests dependency on Edibles where price gains outpaced unit momentum MoM; the pattern implies a positioning risk toward demand elasticity if price-led gains persist against a soft near-term volume trend.
The shift from a 3.33% YoY lift to a 5.52% MoM contraction in September 2026, paired with a 1.64% YoY price increase and a 90.58% 24‑month sales surge, indicates maturation: earlier distribution or penetration gains are tapering into price-sensitive behavior. Holding rank 4 in Oregon while relying on 100.0% Edible mix and anchoring in CA implies the brand’s positioning leans on depth within a single category rather than portfolio breadth; the thesis is that Good Tide must convert past two‑year expansion into mix-driven resilience or targeted price/pack moves to stabilize the MoM dip without eroding the YoY momentum.
Competitive Landscape
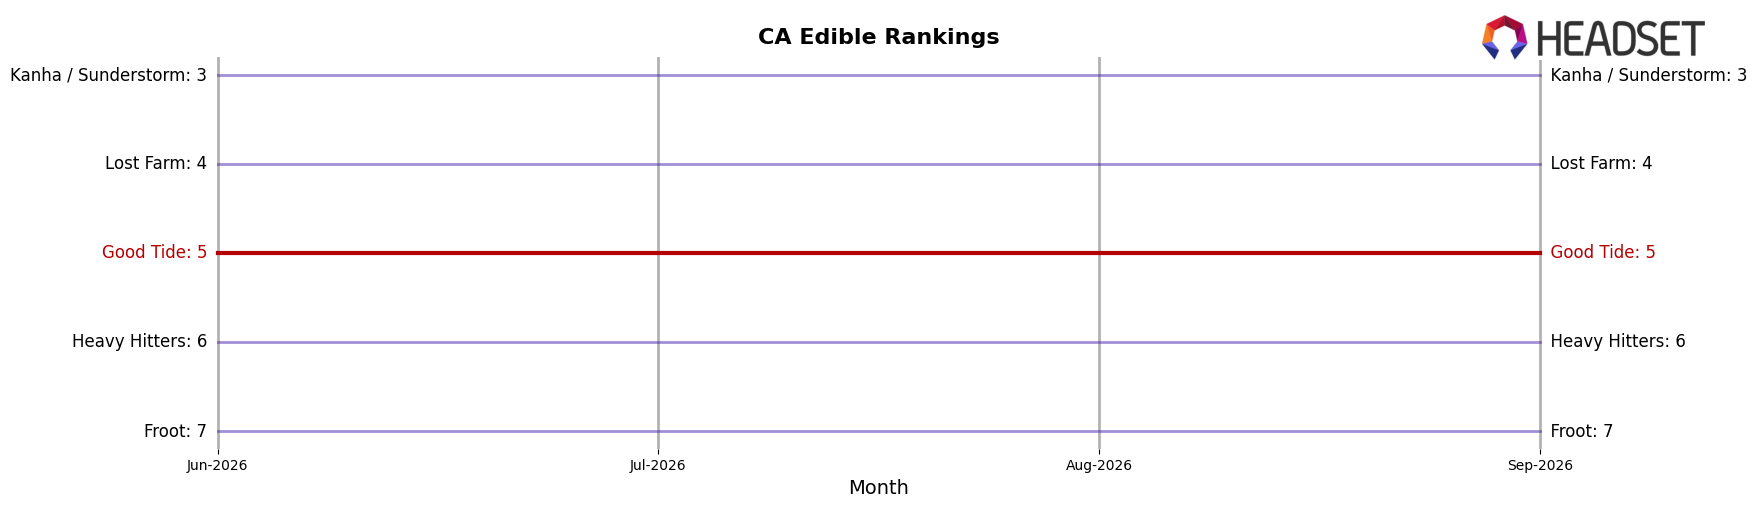
Good Tide is ranked #5 in California Edible for September 2026, unchanged from #5 in September 2025, while Wyld holds #1 with a -21.97% year-over-year sales change and Camino sits at #2 with +10.39% sales growth; additionally, Kanha / Sunderstorm is #3 with +11.45% growth and Lost Farm is #4 with -55.72%, while Good Tide’s rank held at #5 both three months ago and at its peak. The pattern—flat YoY rank at #5 despite #1 declining and #2–#3 growing—implies Good Tide’s current positioning is stable but capped unless it converts share from weakening leaders like Wyld or leapfrogs mid-pack growers.
Notable Products
Good Tide’s steepest movement in September 2026 was a -13.9% month-over-month drop for Uplifting Sativa Pineapple Solventless Hash Rosin High Dose Gummies 10-Pack (200mg), paired with a -12.5% decline for THC/CBN/CBD 2:1:1 Passionfruit Gummies 10-Pack (200mg) as both held ranks 7 and 8 respectively, while the standard-dose Uplifting Sativa Pineapple Solventless Hash Rosin Gummies 10-Pack (100mg) still sat at rank 1 with a smaller -5.1% slide. The concentration is clear with ten of the top ten products in Edibles, and within that, multiple 100mg SKUs in ranks 1–6 fell between -3.0% and -7.1% MoM, even as rank 9 ticked up +4.0% and rank 10 rose +11.2%. Uplifting Sativa Pineapple 100mg and CBN/CBD/THC 1:1:1 Passionfruit 100mg together generated roughly $2.32M despite -4.7% to -5.1% MoM declines, whereas the high-dose counterparts lost share with double-digit contractions. The mix implies Good Tide’s commercial direction is anchored in standard-dose functional gummies while high-dose line extensions are encountering elasticity limits, suggesting assortment and pricing should prioritize 100mg formats over 200mg variants.
Top Selling Cannabis Brands






Data for this report comes from real-time sales reporting by participating cannabis retailers via their point-of-sale systems, which are linked up with Headset’s business intelligence software. Headset’s data is very reliable, as it comes digitally direct from our partner retailers. However, the potential does exist for misreporting in the instance of duplicates, incorrectly classified products, inaccurate entry of products into point-of-sale systems, or even simple human error at the point of purchase. Thus, there is a slight margin of error to consider. Brands listed on this page are ranked in the top twenty within the market and product category by total retail sales volume.

