Jan-2025
Sales
Trend
6-Month
Product Count
SKUs
Overview
Market Insights Snapshot
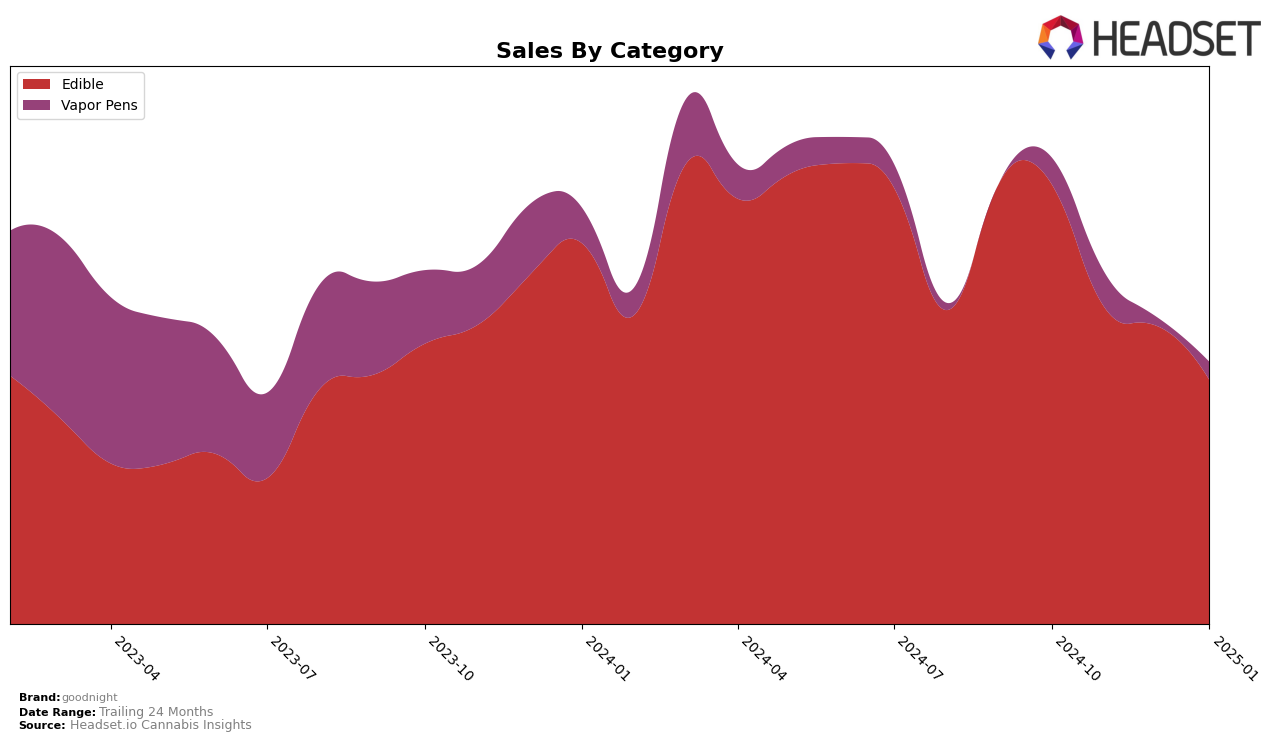
In the Missouri market, goodnight has shown varied performance across different product categories. Within the Edibles category, the brand has maintained its presence among the top 30 brands, albeit with a downward trend from October 2024 to January 2025, slipping from rank 21 to rank 29. This consistent presence, despite the decline, indicates a solid foothold in the Edibles market, although the decreasing rank suggests increasing competition or changing consumer preferences. In contrast, the Vapor Pens category did not see goodnight breaking into the top 30 during these months, reflecting potential challenges or opportunities for growth in this segment.
Examining sales trends, goodnight's Edibles sales in Missouri have shown a steady decline over the months, with a noticeable drop from October to January. This trend might be indicative of seasonal fluctuations or the need for strategic adjustments to reinvigorate consumer interest. Meanwhile, in the Vapor Pens category, goodnight experienced fluctuating sales, peaking in November before declining again. The brand's inability to secure a top 30 position in Vapor Pens suggests that while there may be spikes in consumer interest, sustained growth and market penetration remain a challenge. These insights highlight areas where goodnight could focus efforts to stabilize and potentially expand their market share.
Competitive Landscape
In the Missouri edible cannabis market, goodnight has experienced notable fluctuations in its competitive positioning over the past few months. Starting from a rank of 21 in October 2024, goodnight has seen a decline, reaching the 29th position by January 2025. This downward trend in rank is mirrored by a decrease in sales, from a high in October to a lower figure by January. In contrast, Vibe Cannabis (MO) has shown a positive trajectory, moving from 27th to 26th place, with a corresponding increase in sales. Similarly, Flav has improved its rank from outside the top 20 to 31st, with a significant rise in sales. Meanwhile, Cheeba Chews and CLOVR have maintained relatively stable ranks, with minor fluctuations. These dynamics suggest that while goodnight is facing challenges in maintaining its market position, competitors like Vibe Cannabis (MO) and Flav are capitalizing on growth opportunities, potentially impacting goodnight's market share and necessitating strategic adjustments to regain its competitive edge.

Notable Products
In January 2025, the top-performing product from goodnight was the CBD/CBN/THC 1:1:1 Dreamberry Gummies 40-Pack (100mg CBD, 100mg THC, 100mg CBN), maintaining its first-place rank from December 2024 with sales of 3,375 units. The Good Night- CBD/THC/CBN 1:1:1 Sleep Full Spectrum Disposable (0.5g) climbed to second place from its previous third-place position in December, showing a positive shift in consumer preference. The CBD/THC/CBN 1:1:1 Dreamberry Gummies 40-Pack (300mg CBD, 300mg THC, 300mg CBN, 0.3oz) dropped to third place from second, indicating a slight decline in sales momentum. The CBD/THC/CBN 1:1:1 Dreamberry Gummies 10-Pack (25mg CBD, 25mg THC, 25mg CBN) held the fourth position, consistent with its December ranking. Finally, the CBD/CBN/THC 1:1:1 Dreamberry Gummies 20-Pack (100mg CBD, 100mg THC, 100mg CBN) re-entered the rankings in fifth place, showing a modest increase in sales compared to previous months.
Top Selling Cannabis Brands
Data for this report comes from real-time sales reporting by participating cannabis retailers via their point-of-sale systems, which are linked up with Headset’s business intelligence software. Headset’s data is very reliable, as it comes digitally direct from our partner retailers. However, the potential does exist for misreporting in the instance of duplicates, incorrectly classified products, inaccurate entry of products into point-of-sale systems, or even simple human error at the point of purchase. Thus, there is a slight margin of error to consider. Brands listed on this page are ranked in the top twenty within the market and product category by total retail sales volume.

