.svg)

Aug-2026
Sales
Trend
6-Month
Product Count
SKUs
Avg Price
YoY Sales Change
YoY Price Change


Where to Buy
Havn Extracts is stocked at 58 licensed dispensaries across Massachusetts, with the deepest coverage in Fall River, Ayer, Blackstone, Brockton, and Cambridge. Search by ZIP code or city below to find the closest one, or filter by product type if you are after a specific format.
Market Insights Snapshot
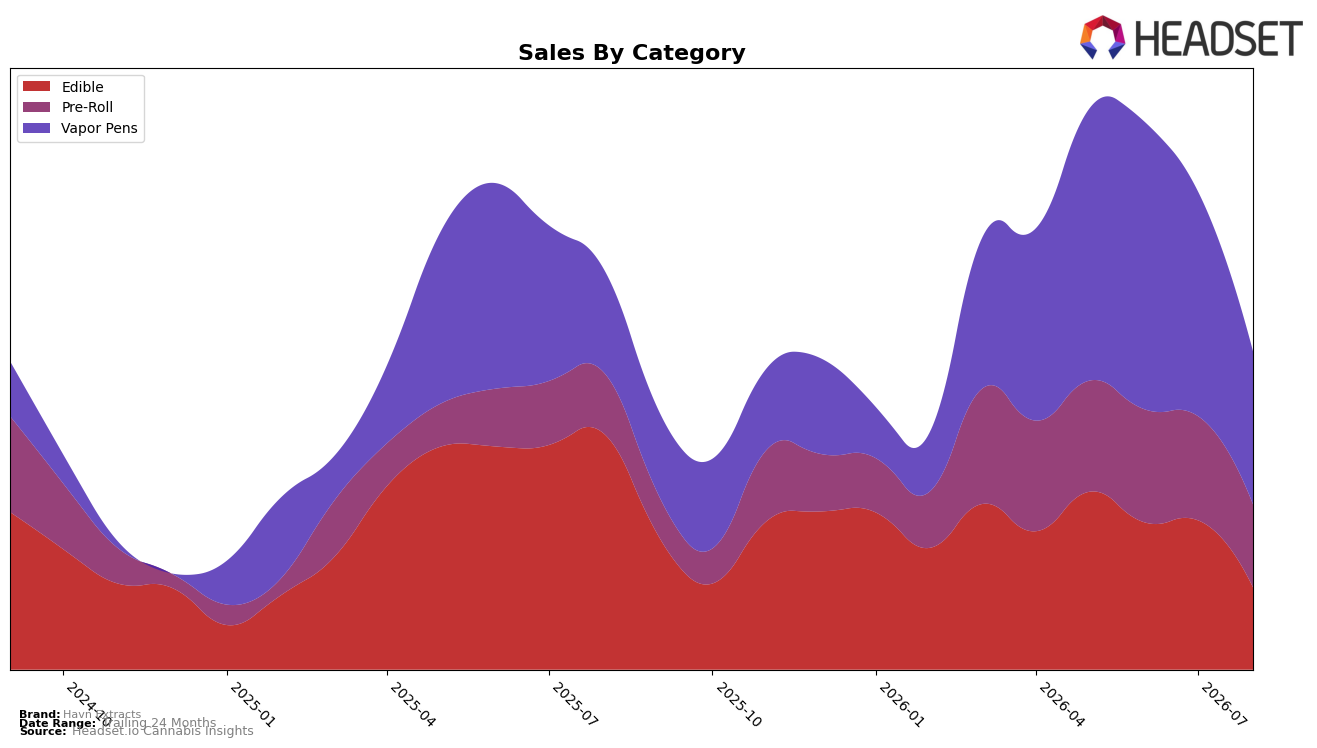
In August 2026, Havn Extracts concentrated 45.31% of sales in Vapor Pens with year-over-year growth of 38.95% but a month-over-month decline of 28.80%, while Pre-Roll held 27.43% share with 25.51% YoY growth and a 16.51% MoM drop. Edible accounted for 27.25% share yet contracted sharply, down 59.02% YoY and 38.61% MoM, pulling overall brand sales down 17.34% YoY despite a 22.74% YoY decrease in average price. The brand’s top state was Massachusetts, and within Vapor Pens it sat at rank 93, indicating a lower-tier foothold that contrasts with the category’s internal YoY expansion. The mix implies a pivot toward inhalables where share is consolidating in Vapor Pens and Pre-Roll, while Edible weakness is now the primary drag on month-over-month trend and price-led elasticity.
The August 2026 shifts suggest Havn Extracts is migrating toward faster-recovering inhalable demand: Vapor Pens’ 45.31% share versus Edible’s 27.25% aligns with a price-sensitive strategy after a 22.74% YoY average price cut, yet the 28.80% MoM decline in Vapor Pens and 16.51% MoM decline in Pre-Roll flag exposure to short-cycle volatility. Holding rank 93 in Vapor Pens in Massachusetts alongside 38.95% YoY Vapor Pens growth points to headroom within the category, but the 59.02% YoY contraction in Edible and 38.61% MoM drop indicate portfolio inefficiency that dilutes scale benefits. The pattern implies Havn Extracts can gain share by reallocating assortment and promotional depth toward Vapor Pens and Pre-Roll while capping Edible variability to stabilize month-over-month performance.
Competitive Landscape
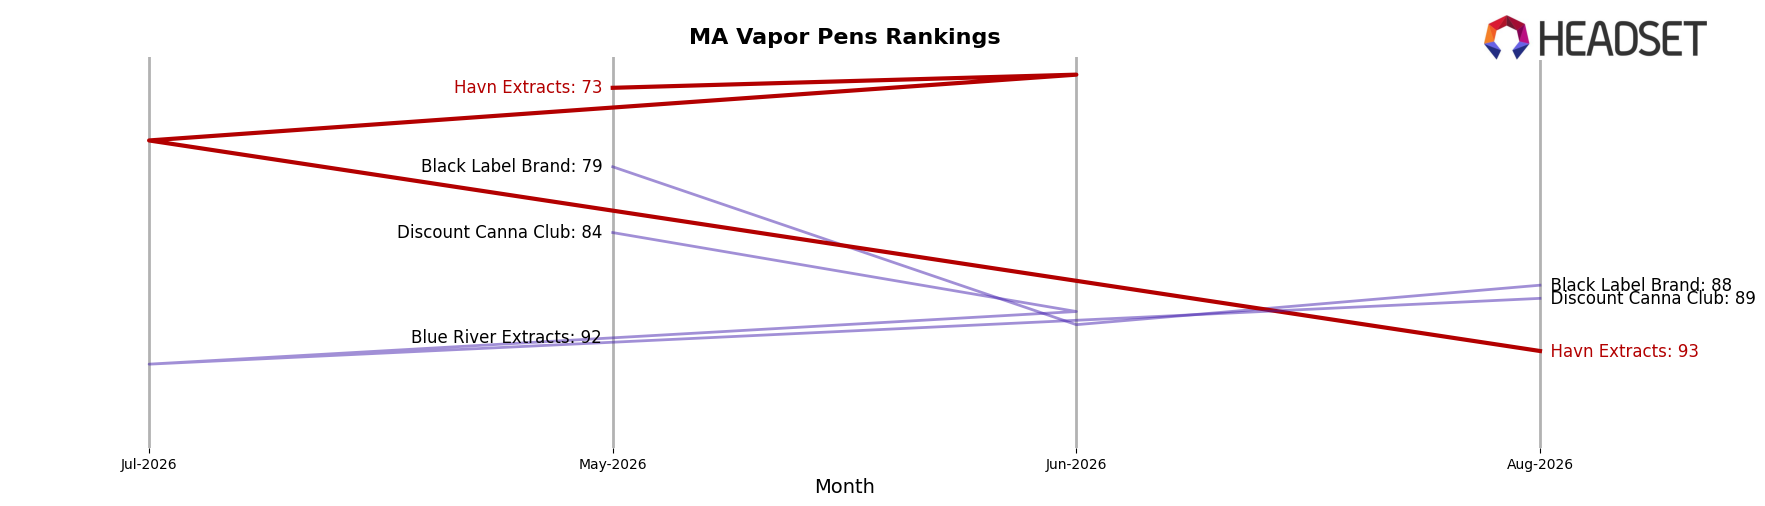
Havn Extracts sits at rank #93 in MA Vapor Pens in August 2026, unchanged from #93 year over year, after sliding from #73 three months ago; this flat YoY position paired with a 20-place drop since May 2026 contrasts with category leaders where Fernway held #1 both this year and last while Dime Industries advanced from #6 to #4 as sales grew 54.2%. Competitive pressure is also visible as Jeeter vaulted from #33 to #5 with 433.9% YoY sales growth, while Select remained at #2 despite a 12.8% YoY sales decline; against this backdrop, Havn Extracts’ peak of #71 in June 2025 versus today’s #93 indicates a trajectory of declining share amid accelerating moves by faster-rising rivals, implying that without a rank recovery the brand risks further marginalization within the top 100.
Notable Products
THC/CBN 2:1 Blackberry Gummies 20-Pack (100mg THC, 50mg CBN) posted the steepest decline at -33.5% MoM while sliding to rank 2, and Blueberry Cupcake Hash Rosin Infused Pre-Roll (1g) fell -45.3% MoM at rank 8, signaling acute volatility in two lead formats. In contrast, Raspberry Lemonade Hash Rosin Gummies 20-Pack (100mg) grew 8.9% MoM at rank 3 as Double Durban THCV Full Spectrum Disposable (1g) held nearly flat at -0.3% MoM in rank 4, indicating stabilization outside the sharp fallers. With four of the top ten coming from the Pre-Roll family and three from Edibles, the weight is tilting toward format breadth rather than a single hero, but the outsized drops in a flagship edible and a key infused pre-roll imply assortment pruning is needed to protect mix while defending the $6,473 anchor from the vapor pen line.
Top Selling Cannabis Brands






Data for this report comes from real-time sales reporting by participating cannabis retailers via their point-of-sale systems, which are linked up with Headset’s business intelligence software. Headset’s data is very reliable, as it comes digitally direct from our partner retailers. However, the potential does exist for misreporting in the instance of duplicates, incorrectly classified products, inaccurate entry of products into point-of-sale systems, or even simple human error at the point of purchase. Thus, there is a slight margin of error to consider. Brands listed on this page are ranked in the top twenty within the market and product category by total retail sales volume.

