Jun-2026
Sales
Trend
6-Month
Product Count
SKUs
Avg Price
YoY Sales Change
YoY Price Change
Market Insights Snapshot
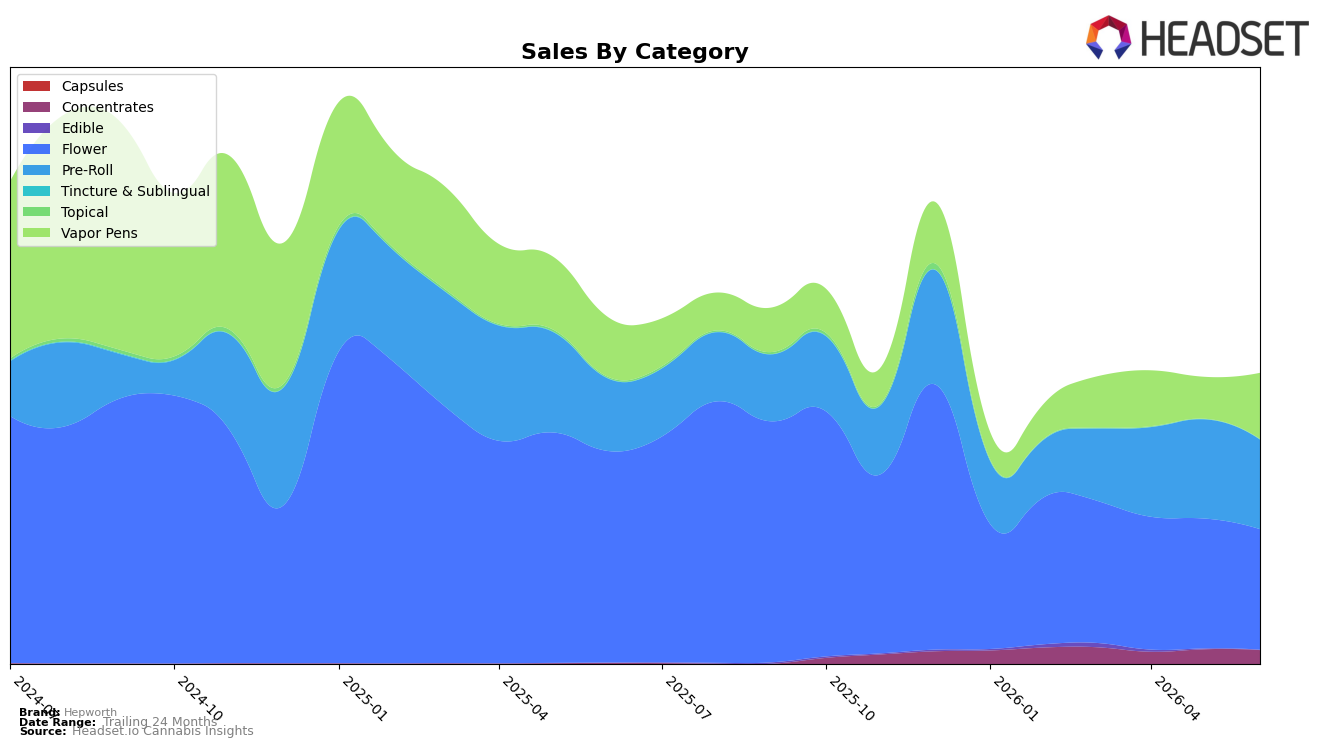
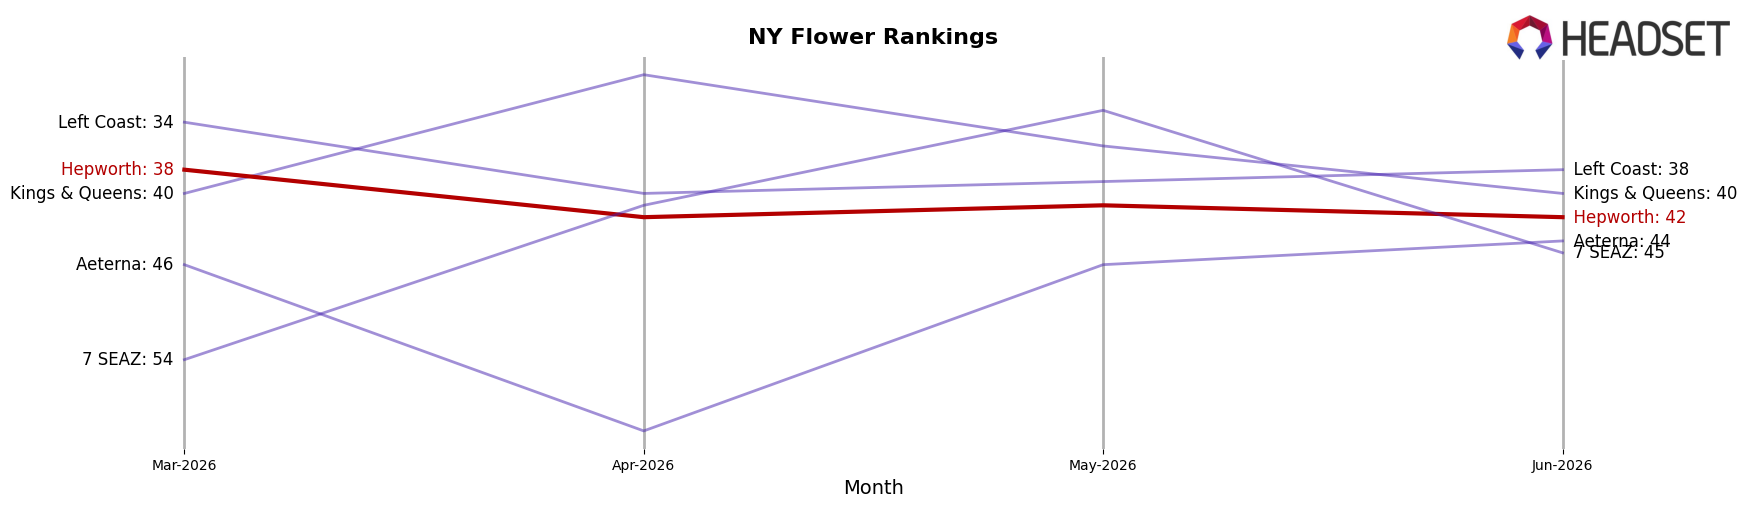
Hepworth’s mix in June 2026 tilted toward Flower at 41.58% share with year-over-year decline of 43.10% and month-over-month decline of 7.25%, while Pre-Roll held 30.87% share with year-over-year growth of 23.70% but a 9.77% month-over-month dip; Vapor Pens reached 22.79% share with 10.93% year-over-year growth and a 58.18% month-over-month surge. Smaller lines were volatile: Concentrates rose 1611.56% year over year but slipped 5.73% month over month to 4.70% share, and Edible climbed 175.96% year over year but fell 67.04% month over month to 0.06% share. With average price down 20.97% year over year and total brand sales down 16.14% year over year, the pattern implies a shift away from premium-priced Flower into faster-moving inhalables, with New York Flower rank at 42 reinforcing pressure on the legacy core.
The mix shifts imply Hepworth is repositioning toward value-accessible inhale formats: Vapor Pens’ 58.18% month-over-month lift and 10.93% year-over-year growth, alongside Pre-Roll’s 23.70% year-over-year increase but 9.77% monthly pullback, indicate elastic demand responding to lower price points as average price fell 20.97% year over year. Concentrates’ extreme 1611.56% year-over-year expansion to only 4.70% share and Edible’s 175.96% year-over-year rise to 0.06% share signal niche tests rather than scale, while Flower’s 43.10% year-over-year contraction at 41.58% share and a 7.25% monthly decline, coupled with rank 42 in New York Flower, suggest defending share now requires doubling down on pen and pre-roll velocity over restoring premium Flower price architecture.
Competitive Landscape
Hepworth sits at rank #42 in June 2026, down 20 positions year over year from #22, and 4 positions below March 2026’s #38, while its prior peak was #7 in June 2024; meanwhile, Find. climbed from #3 to #1 and RYTHM rose from #10 to #5 with a 40.6% year-over-year sales increase, indicating that the gap is widening at both the top and within the top five. With Leal advancing from #7 to #2 and Dank. By Definition slipping from #1 to #3 despite a 50.7% sales decline, the mix of ascenders and decliners suggests Hepworth’s 20-rank YoY slide and 4-rank drop since March 2026 stem more from share being consolidated by faster risers than from broad market contraction; the trajectory implies Hepworth must arrest loss of relative velocity or risk drifting out of the top 50 as leadership firms compound gains.
Notable Products
Blue Nerds (3.5g) posted the steepest movement in June 2026 with a -40.7% MoM drop while sliding to rank 5, signaling demand erosion inside Flower even as Mango Dog x White Runtz (3.5g) rose +10.1% to hold rank 1. Kush Mintz x Gelato 41 (3.5g) fell -13.1% at rank 3 and GMO Rootbeer (3.5g) declined -14.9% at rank 8, meaning three Flower SKUs in the top 10 carry double-digit declines against just one MoM gainer in the same category. Vapor Pens occupy ranks 2, 6, 9, and 10 with several SKUs newly charting and no MoM percentages reported, concentrating four of the top ten in Vapor Pens and implying mix shift as Flower volatility creates headroom for cartridges.
Top Selling Cannabis Brands
Data for this report comes from real-time sales reporting by participating cannabis retailers via their point-of-sale systems, which are linked up with Headset’s business intelligence software. Headset’s data is very reliable, as it comes digitally direct from our partner retailers. However, the potential does exist for misreporting in the instance of duplicates, incorrectly classified products, inaccurate entry of products into point-of-sale systems, or even simple human error at the point of purchase. Thus, there is a slight margin of error to consider. Brands listed on this page are ranked in the top twenty within the market and product category by total retail sales volume.

