Jan-2025
Sales
Trend
6-Month
Product Count
SKUs
Overview
Market Insights Snapshot
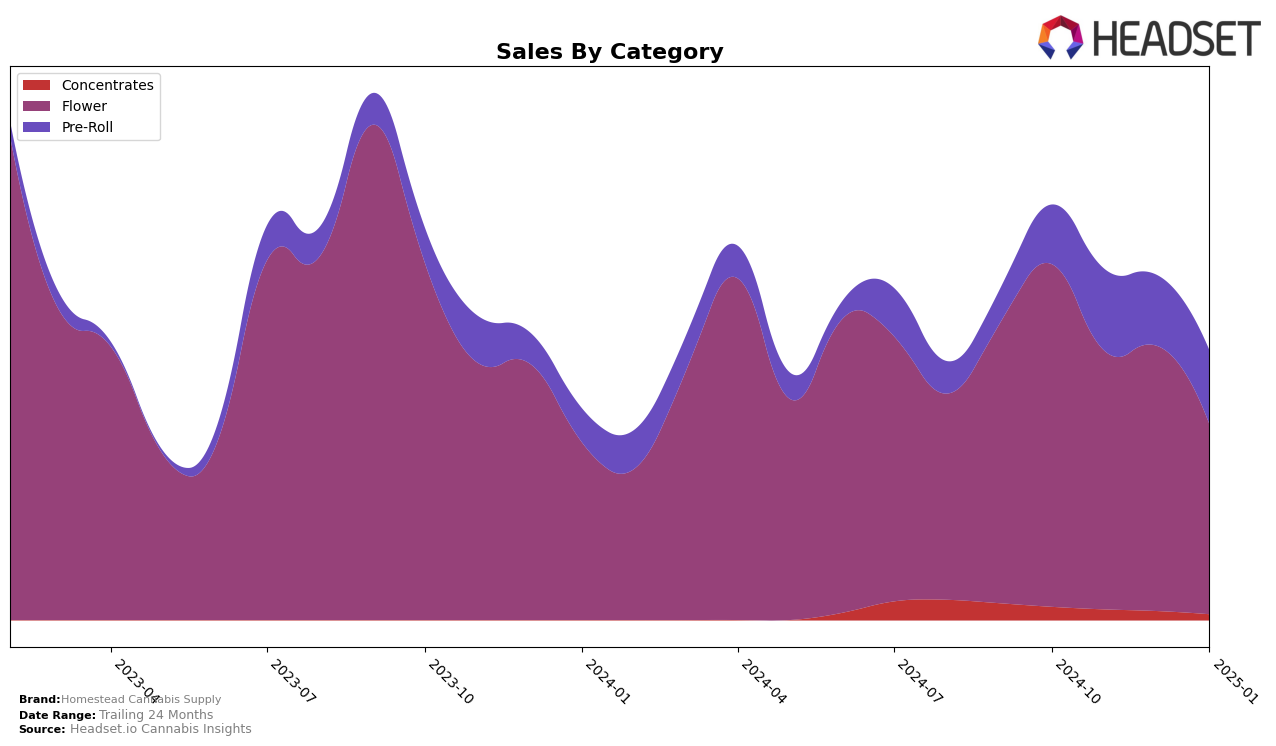
Homestead Cannabis Supply's performance in the British Columbia market has shown notable fluctuations across different categories. In the Flower category, the brand maintained a presence within the top 30 rankings throughout the last quarter of 2024 and into January 2025, with rankings shifting from 16th in October to 30th by January. This suggests a competitive landscape where Homestead is still managing to hold its ground. Meanwhile, in the Pre-Roll category, the brand's rankings varied moderately, moving between 50th and 60th place, indicating a relatively stable but less dominant position in this segment. Such movements highlight the brand's ability to sustain its market presence in a highly competitive environment.
In Alberta and Ontario, Homestead Cannabis Supply appears to face more challenges. The brand did not make it into the top 30 rankings for any category in Alberta, which could be a point of concern for the brand's market penetration efforts in this province. In Ontario, while they were ranked 84th and 91st for the Flower category in October and November 2024, respectively, they did not maintain a top 30 presence into December and January. This drop outside the top 30 in Ontario could indicate increasing competition or a need for strategic adjustments to improve their standing. These regional differences underscore the varying dynamics Homestead Cannabis Supply faces across Canadian provinces.
Competitive Landscape
In the competitive landscape of the Flower category in British Columbia, Homestead Cannabis Supply has experienced notable fluctuations in its market position and sales performance. Despite starting strong with a rank of 16 in October 2024, Homestead saw a decline to 26 in November, before slightly recovering to 21 in December, and then dropping again to 30 in January 2025. This volatility contrasts with brands like Broken Coast, which maintained a relatively stable presence, peaking at rank 21 in November before falling to 32 in January. Meanwhile, QWEST demonstrated a significant upward trajectory, moving from rank 54 in October to 28 by January, suggesting a growing consumer preference. Hiway and Magi Cannabis also showed more consistent rankings, with Hiway only slightly dropping from 23 to 31 over the same period. These dynamics indicate that while Homestead Cannabis Supply has the potential to capture significant market share, it faces stiff competition and must strategize effectively to stabilize and improve its ranking amidst competitors who are either gaining momentum or maintaining steadier positions.

Notable Products
In January 2025, the top-performing product from Homestead Cannabis Supply was Bandwagon Indica (7g) in the Flower category, maintaining its consistent first-place ranking from the previous months, with sales reaching 1501 units. Bang Tail Milled (7g), also in the Flower category, rose to the second position after having been ranked third in December 2024, indicating a positive shift in consumer preference. The Bangtail Pre-Roll 10-Pack (5g) showed an improvement, climbing to third place from fourth in December 2024, reflecting a growing trend in pre-roll purchases. Bandwagon Indica (28g) experienced a drop to fourth place, despite having been second in December 2024, suggesting a potential shift in consumer demand towards smaller quantities. Organic Gorilla Cookies (7g) maintained its fifth-place position, indicating stable but modest sales figures within its category.
Top Selling Cannabis Brands
Data for this report comes from real-time sales reporting by participating cannabis retailers via their point-of-sale systems, which are linked up with Headset’s business intelligence software. Headset’s data is very reliable, as it comes digitally direct from our partner retailers. However, the potential does exist for misreporting in the instance of duplicates, incorrectly classified products, inaccurate entry of products into point-of-sale systems, or even simple human error at the point of purchase. Thus, there is a slight margin of error to consider. Brands listed on this page are ranked in the top twenty within the market and product category by total retail sales volume.


