Jun-2026
Sales
Trend
6-Month
Product Count
SKUs
Avg Price
YoY Sales Change
YoY Price Change
Market Insights Snapshot
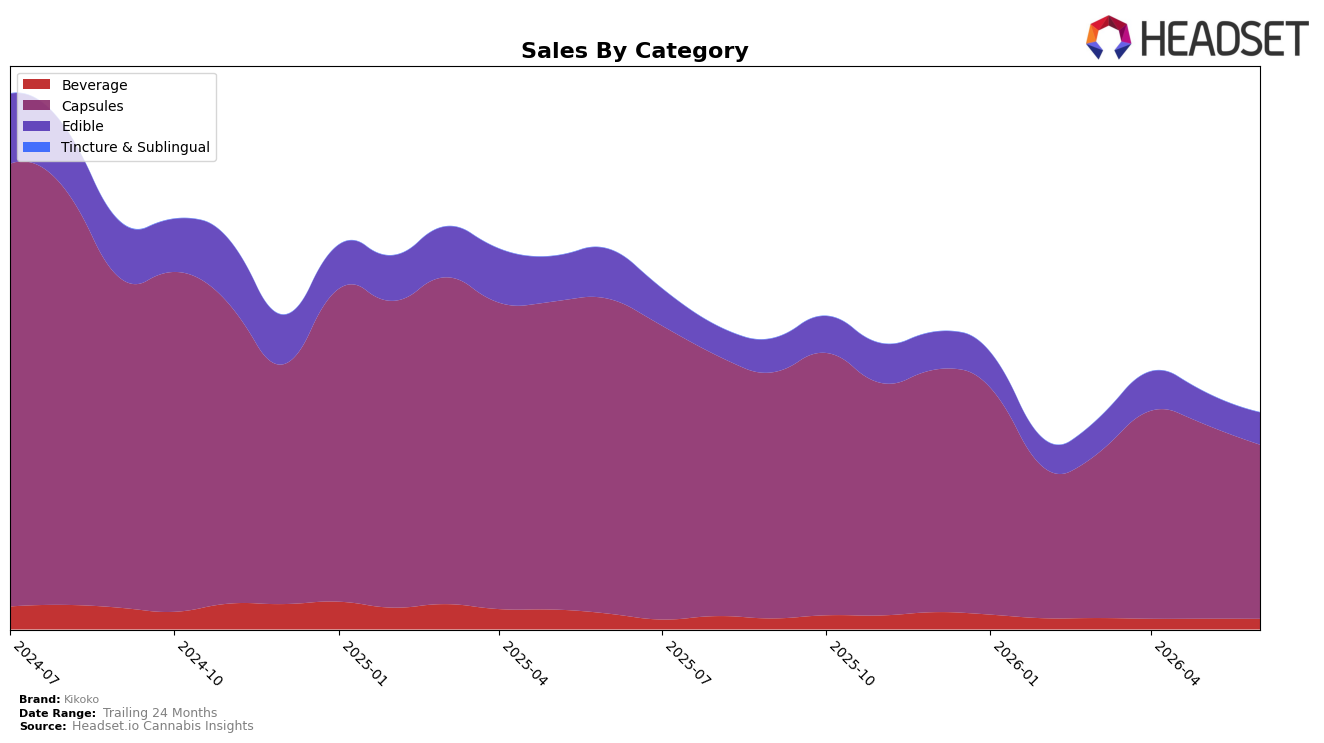
Kikoko’s mix in June 2026 is concentrated in Capsules at 80.48% share, with Edible at 14.77% and Beverage at 4.75%; within this, Capsules fell 44.76% year over year and 10.48% month over month, while Edible declined 35.51% year over year and 0.34% month over month. Beverage contracted 33.56% year over year and 1.01% month over month, and the brand’s overall average price moved down 5.29% year over year against a category-leading Capsules average price of $42.15. With a rank of 6 in Capsules in California, the pattern implies Kikoko is over-indexed in a subcategory with the steepest short-term decline, concentrating risk as Capsules pulls down total performance.
The shift suggests a positioning tied to premium-priced Capsules, where a 10.48% month-over-month volume pullback outpaced Edible’s 0.34% and Beverage’s 1.01% declines, indicating sensitivity to price or format within the largest exposure bucket. Given a 44.76% year-over-year Capsules decline alongside a 35.51% Edible decline, the brand’s reliance on Capsules limits diversification benefits; sustaining a 6th-place rank in California while the core shrinks implies the near-term path is to rebalance toward lower-price formats or defend Capsules with targeted pricing, as the current mix makes market share more volatile when Capsules trends worsen.
Competitive Landscape
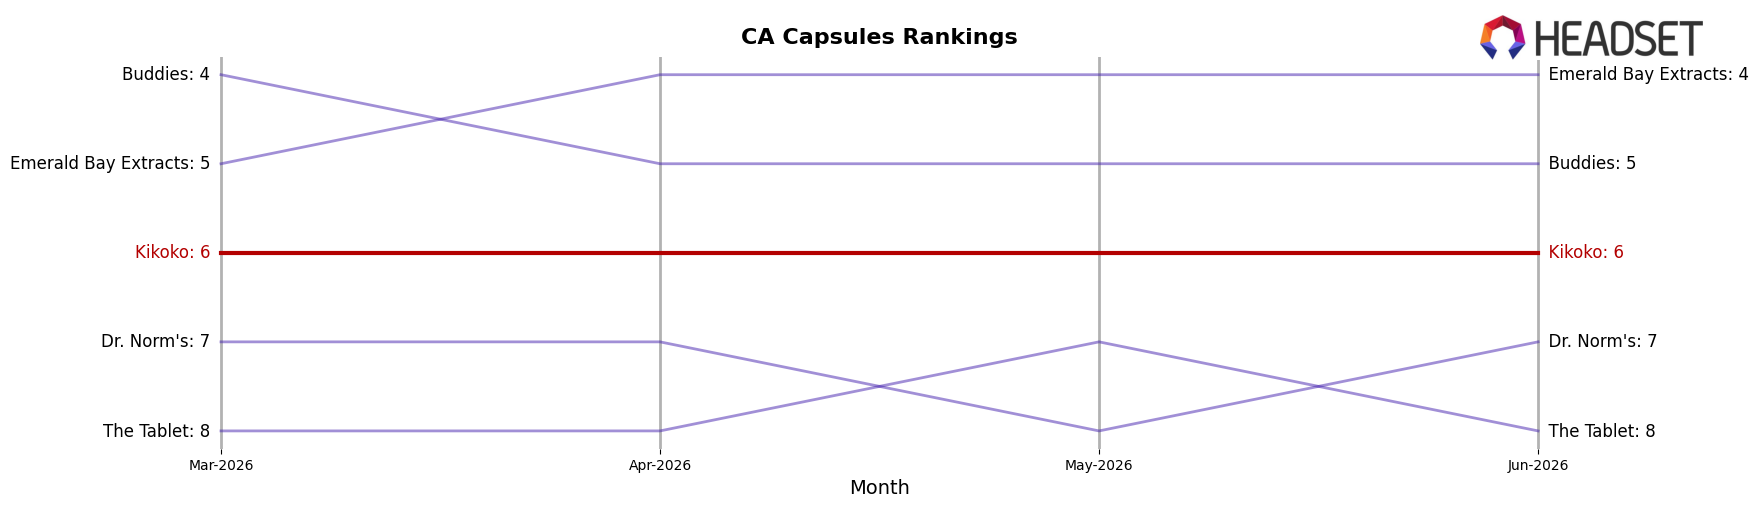
Kikoko sits at rank #6 in California Capsules in June 2026, down 2 positions from #4 year over year, and unchanged from #6 three months ago, while its best-ever rank of #4 came in December 2025. In contrast, Breez holds #1 after rising from #2 year over year despite a 37% sales decline, and Buddies moved up to #5 from #6 with a 29.8% sales increase, indicating Kikoko’s relative slippage against a mix of contracting leaders and a growing mid-pack challenger. This pattern implies Kikoko’s flat quarter-on-quarter position at #6 coupled with a two-rank YoY drop signals a need to defend share against ascending #5 while targeting re-entry into the #4–#5 band where churn is evident.
Notable Products
Little Helpers - THC/THCV 1:1 Boost Matcha Botanical Mints 20-Pack (50mg THC, 50mg THCV) posted the steepest decline at -22.88% and slid to rank 8, while Little Helpers - CBN/THC/Melatonin 3:2 Sleep Mints 20-Pack (60mg CBN, 40mg THC, 20mg Melatonin) fell -22.17% to rank 4; in contrast, Little Helpers - CBD/THC 2:1 Calm Mints 20-Pack (100mg CBD, 50mg THC) rose 25.56% to rank 6. XTabs - Sativa High Dose Tablets 20-Pack (1000mg) dipped -5.22% but remained rank 1, and XTabs - Indica High Dose Tablets 20-Pack (1000mg) dropped -14.01% at rank 2, with three XTabs SKUs holding ranks 1–3 to concentrate leadership in Capsules. Two new 40-Pack Edible formats entered at ranks 9–10 without prior month comps, signaling SKU extension rather than velocity gains. The pattern implies Kikoko is leaning on high-dose Capsules for volume while using diversified Edible formats to probe for incremental occasions, not to replace the core tablet franchise.
Top Selling Cannabis Brands
Data for this report comes from real-time sales reporting by participating cannabis retailers via their point-of-sale systems, which are linked up with Headset’s business intelligence software. Headset’s data is very reliable, as it comes digitally direct from our partner retailers. However, the potential does exist for misreporting in the instance of duplicates, incorrectly classified products, inaccurate entry of products into point-of-sale systems, or even simple human error at the point of purchase. Thus, there is a slight margin of error to consider. Brands listed on this page are ranked in the top twenty within the market and product category by total retail sales volume.

