Market Insights Snapshot
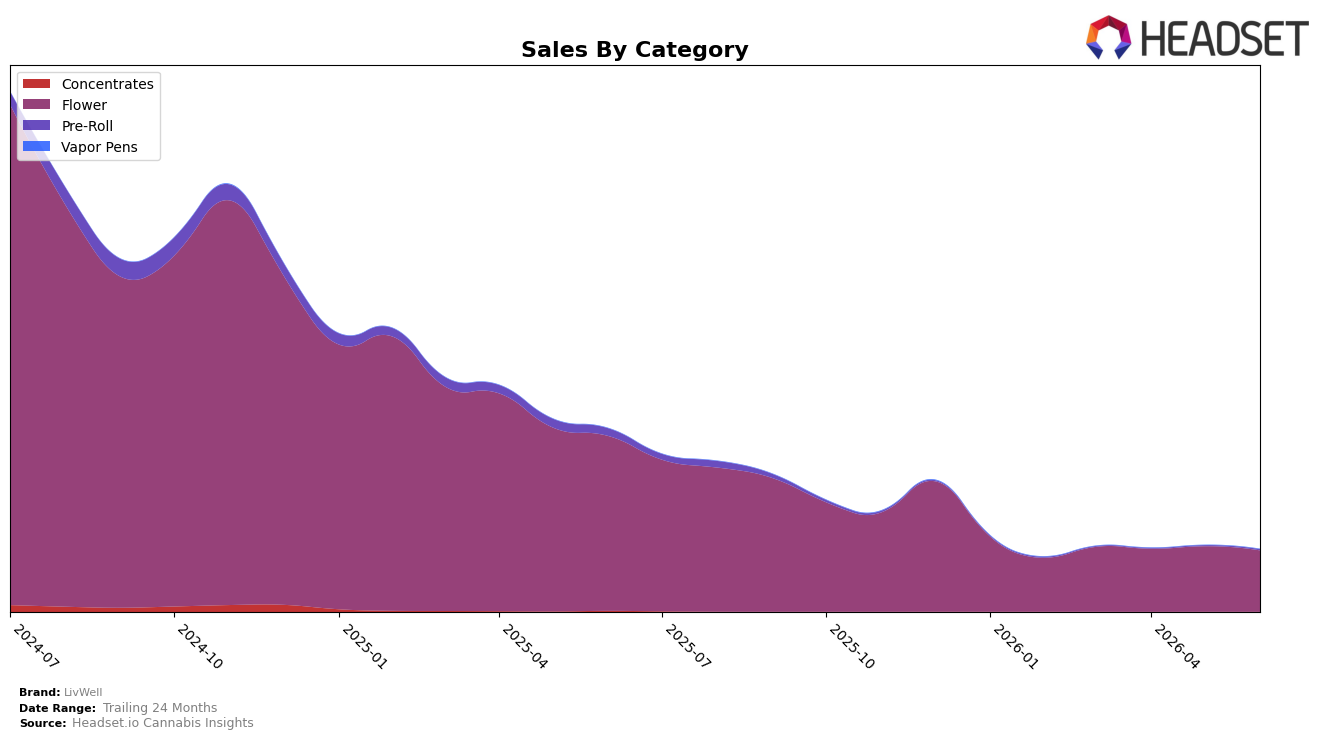
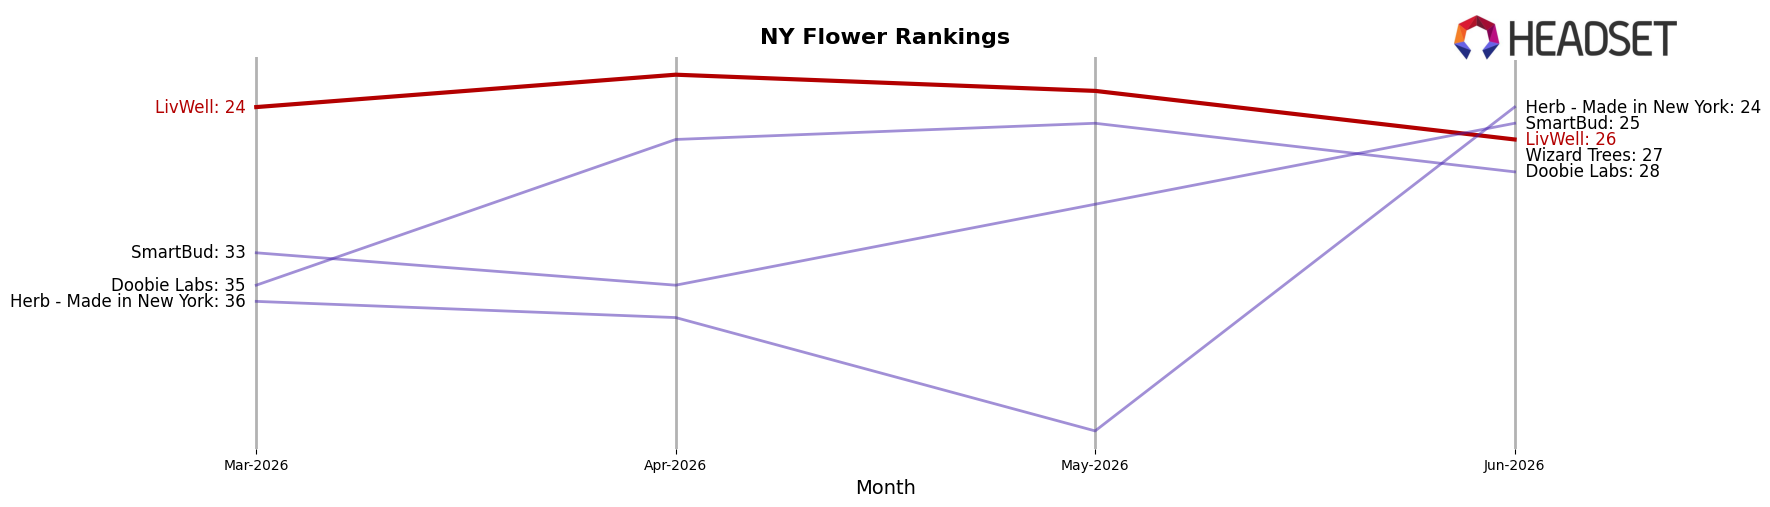
LivWell’s category mix in June 2026 compressed further into Flower, with share rising to 98.68% while Pre-Roll held 1.29% and Concentrates fell to 0.02%; despite that concentration, Flower declined 65.05% year over year and 6.34% month over month, while Pre-Roll plunged 88.96% year over year but rebounded 28.75% month over month. Average price fell 70.59% year over year to $18.87, with Flower pricing at $19.31 and Pre-Roll at $6.89, and overall brand sales were down 66.18% year over year against a 24‑month decline of 86.17%. In New York Flower, LivWell sat at rank 26, indicating that the near-total reliance on Flower is not translating into rank gains despite aggressive price contraction; the pattern implies the brand is leaning on discount-driven Flower volume while ceding breadth and resilience from smaller formats.
The mix shift implies a defensive posture anchored in low-priced Flower, where a 70.59% price drop year over year is not offsetting a 65.05% sales decline in the core category, and rank 26 in New York Flower signals limited differentiation at the shelf. The 28.75% month-over-month uptick in Pre-Roll from a 1.29% share base, alongside a 63.34% month-over-month decline in Concentrates to 0.02% share, suggests experimentation at the edges without material diversification; the implication is that LivWell’s current positioning trades margin and optionality for a single-category bet that constrains recovery paths if Flower traffic softens further.
Competitive Landscape
LivWell sits at rank #26 in NY Flower in June 2026, sliding 20 positions year over year from #6, and down 2 spots versus March 2026’s #24, while its historical peak was #2 in February 2025; in contrast, Find. climbed 3 ranks year over year to #1 with a 35.6% sales increase and RYTHM advanced 10 ranks to #5 alongside a 40.6% YoY lift, whereas Dank. By Definition fell 1 rank to #3 with sales down 50.7%. This combination—LivWell’s 20-rank YoY drop alongside top competitors gaining 3 to 10 spots—implies LivWell’s trajectory is one of share reallocation away from the brand unless it reverses multi-quarter rank slippage.
Notable Products
Tropic Delight Smalls (Bulk) posted the largest month-over-month surge at +88.4% to rank 4, while Lotus Lullaby Smalls (Bulk) fell 48.9% to rank 6. Master Mint Smalls (Bulk) also declined 31.1% at rank 5, and Apple Fritter (28g) slipped 2.4% at rank 8. With eight of the top ten in Flower and multiple Smalls formats clustered in ranks 1–6, the mix points to a pivot toward value-driven bulk Flower anchoring June 2026 volume, with premium ounce SKUs like Strawberry Cookies (28g) at rank 7 balancing basket size.
Top Selling Cannabis Brands
Data for this report comes from real-time sales reporting by participating cannabis retailers via their point-of-sale systems, which are linked up with Headset’s business intelligence software. Headset’s data is very reliable, as it comes digitally direct from our partner retailers. However, the potential does exist for misreporting in the instance of duplicates, incorrectly classified products, inaccurate entry of products into point-of-sale systems, or even simple human error at the point of purchase. Thus, there is a slight margin of error to consider. Brands listed on this page are ranked in the top twenty within the market and product category by total retail sales volume.

