Mar-2025
Sales
Trend
6-Month
Product Count
SKUs
Overview
Market Insights Snapshot
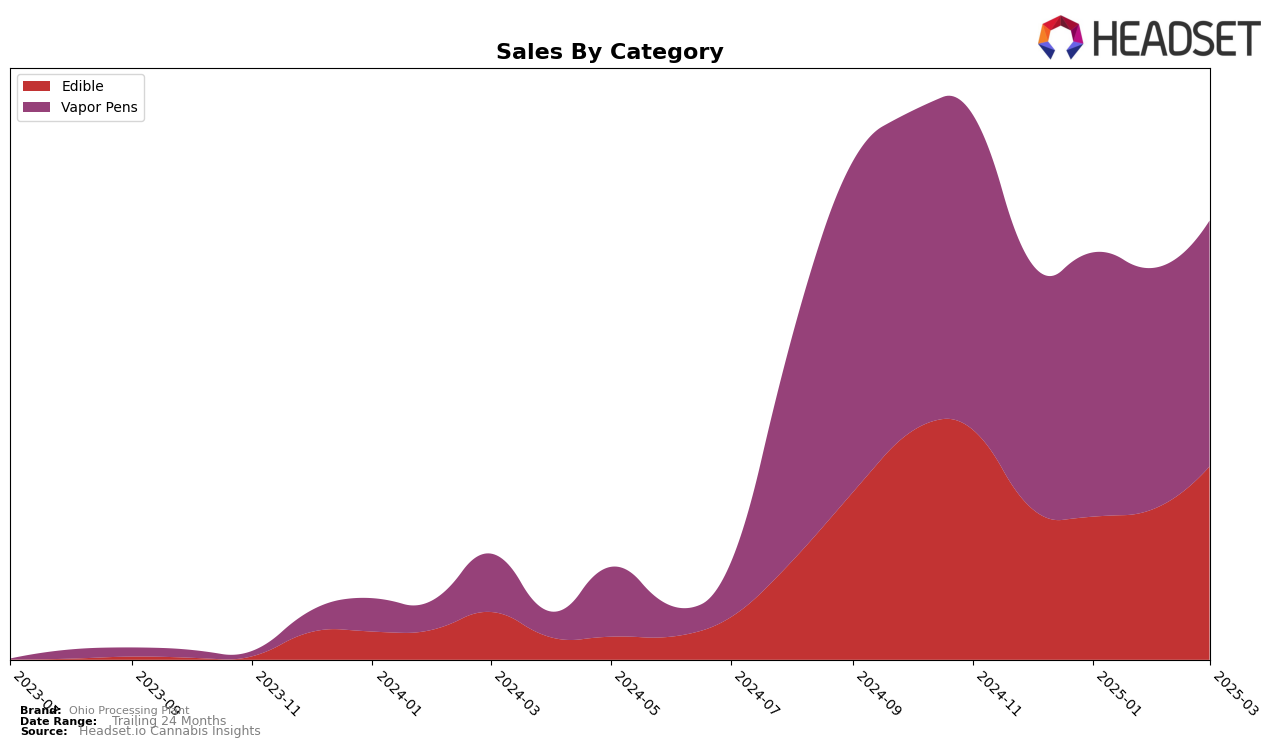
In the state of Ohio, Ohio Processing Plant has demonstrated a consistent presence in the Edible category, maintaining a ranking within the top 20 brands from December 2024 to March 2025. Notably, the brand saw a significant increase in sales from February to March, suggesting a positive reception of their products or successful marketing strategies during this period. Despite a slight dip in January, the brand's ability to rebound and improve its sales figures by March indicates a robust market presence and potential growth trajectory in the Edible category. However, the brand's absence from the top 30 in other states or provinces could suggest a more localized strength or a need to expand its market reach beyond Ohio.
In the Vapor Pens category, Ohio Processing Plant's performance in Ohio has been relatively stable, though slightly more volatile compared to their Edible offerings. The brand fluctuated between the 20th and 23rd positions from December 2024 to March 2025, with sales peaking in January before experiencing a decline in February. This pattern suggests potential challenges in maintaining consumer interest or competition from other brands in the Vapor Pens market. The absence of Ohio Processing Plant from the top 30 rankings in other states or provinces underscores the need for strategic initiatives to enhance their market presence and competitiveness in broader regions.
Competitive Landscape
In the competitive landscape of vapor pens in Ohio, Ohio Processing Plant has experienced some fluctuations in its market position from December 2024 to March 2025. Initially ranked 21st in December 2024, the brand improved slightly to 20th in January 2025, but then dropped to 22nd and 23rd in the subsequent months. This indicates a challenging environment where competitors like AiroPro maintained a consistent 17th rank before slipping out of the top 20 in March 2025. Meanwhile, King City Gardens showed a strong upward trajectory, climbing from outside the top 20 to 21st by March 2025. Additionally, Woodward Fine Cannabis demonstrated significant growth, moving from 34th in December 2024 to 24th by March 2025. These shifts highlight the dynamic nature of the market and suggest that Ohio Processing Plant may need to innovate or adjust strategies to regain a stronger foothold amidst rising competition.

Notable Products
In March 2025, Ohio Processing Plant's top-performing product was the Strawberry Banana Cream Distillate Cartridge (0.84g) in the Vapor Pens category, which reclaimed its top position from December 2024 after a slight dip in January 2025. It achieved this with notable sales of 2,518 units. The Ghost Train Haze Distillate Cartridge (0.84g) maintained a strong second place, consistent with its February 2025 ranking. Diablo OG Distillate Cartridge (0.84g) improved its standing from fifth place in February to third in March. Meanwhile, the Mixed Berry Gummies 10-Pack (100mg) saw a drop from first place in January and February to fourth, indicating a shift in consumer preference towards vapor pen products.
Top Selling Cannabis Brands
Data for this report comes from real-time sales reporting by participating cannabis retailers via their point-of-sale systems, which are linked up with Headset’s business intelligence software. Headset’s data is very reliable, as it comes digitally direct from our partner retailers. However, the potential does exist for misreporting in the instance of duplicates, incorrectly classified products, inaccurate entry of products into point-of-sale systems, or even simple human error at the point of purchase. Thus, there is a slight margin of error to consider. Brands listed on this page are ranked in the top twenty within the market and product category by total retail sales volume.

