Jan-2025
Sales
Trend
6-Month
Product Count
SKUs
Overview
Market Insights Snapshot
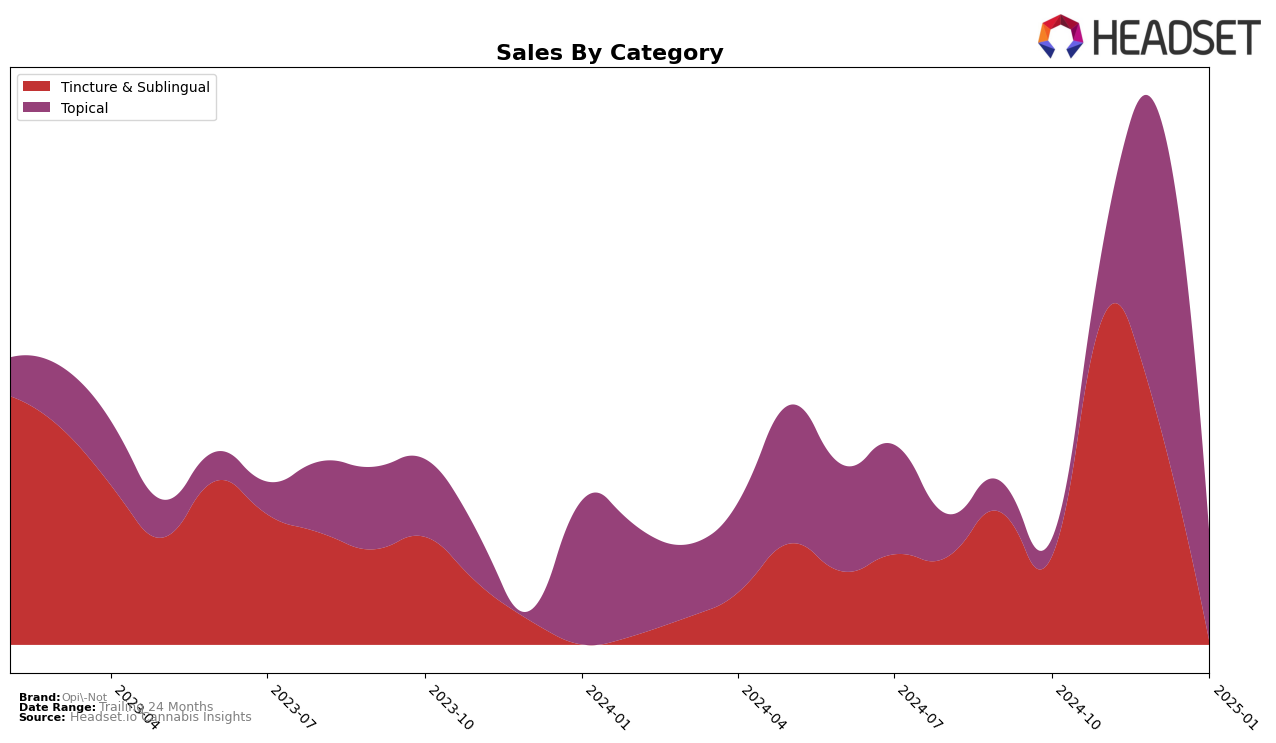
In the California market, Opi-Not has demonstrated noteworthy performance in the Tincture & Sublingual category, where it climbed to the 20th position in November 2024 before slightly dropping to the 21st rank in December 2024. This fluctuation indicates a competitive environment, yet Opi-Not managed to maintain a presence in the top 30, which is significant given the crowded nature of the market. However, by January 2025, the brand was no longer in the top 30, suggesting a potential need for strategic adjustments to regain its standing. The sales figures from October to November 2024 also reflect a decline, which could be a point of concern for the brand's management.
In the Topical category, Opi-Not emerged in January 2025 as the 14th ranked brand, marking its first appearance in the top 30 since October 2024. This is a positive development, as it suggests a successful penetration into a new category, potentially diversifying its market presence in California. The absence of ranking data for November and December 2024 indicates that the brand was not among the top 30 during those months, which might have been a strategic period of product development or market testing. This recent entry into the Topical category could signal a promising growth trajectory for Opi-Not, setting the stage for further expansion and market share capture.
Competitive Landscape
In the California Tincture & Sublingual category, Opi-Not experienced a notable fluctuation in its market position over the observed months. Initially absent from the top 20 rankings in October 2024, Opi-Not made a significant entry in November 2024, securing the 20th position. However, by December 2024, it slipped to 21st place, indicating a slight decline in its competitive standing. This shift in rank is particularly interesting when compared to competitors like High Gorgeous by Yummi Karma and Kind Medicine, both of which were not in the top 20 during the same period. Despite the drop in rank, Opi-Not's sales in November were higher than those of its competitors, suggesting that while its market presence may have waned slightly, its sales performance remained relatively strong. This dynamic indicates potential for Opi-Not to regain its footing in the market with strategic adjustments.

Notable Products
In January 2025, the CBD:THC 1:1 Sandalwood Spice Nano Lotion (250mg THC, 250mg CBD, 3oz) maintained its top position from December 2024, leading the sales for Opi-Not with 172 units sold. The CBD/THC 1:1 Daytime Nano Tincture (300mg CBD, 300mg THC, 30ml) held steady in second place, though its sales saw a significant drop compared to previous months. The CBD/THC 1:1 Nighttime Nano Tincture did not rank in January 2025, after being third in December 2024. Notably, the CBD:THC 20:1 Sandalwood Spice Nano Lotion, which was fourth in December, did not appear in the rankings for January. This shift highlights a strong preference for the CBD:THC 1:1 Sandalwood Spice Nano Lotion among consumers in the new year.
Top Selling Cannabis Brands
Data for this report comes from real-time sales reporting by participating cannabis retailers via their point-of-sale systems, which are linked up with Headset’s business intelligence software. Headset’s data is very reliable, as it comes digitally direct from our partner retailers. However, the potential does exist for misreporting in the instance of duplicates, incorrectly classified products, inaccurate entry of products into point-of-sale systems, or even simple human error at the point of purchase. Thus, there is a slight margin of error to consider. Brands listed on this page are ranked in the top twenty within the market and product category by total retail sales volume.

