Jan-2025
Sales
Trend
6-Month
Product Count
SKUs
Overview
Market Insights Snapshot
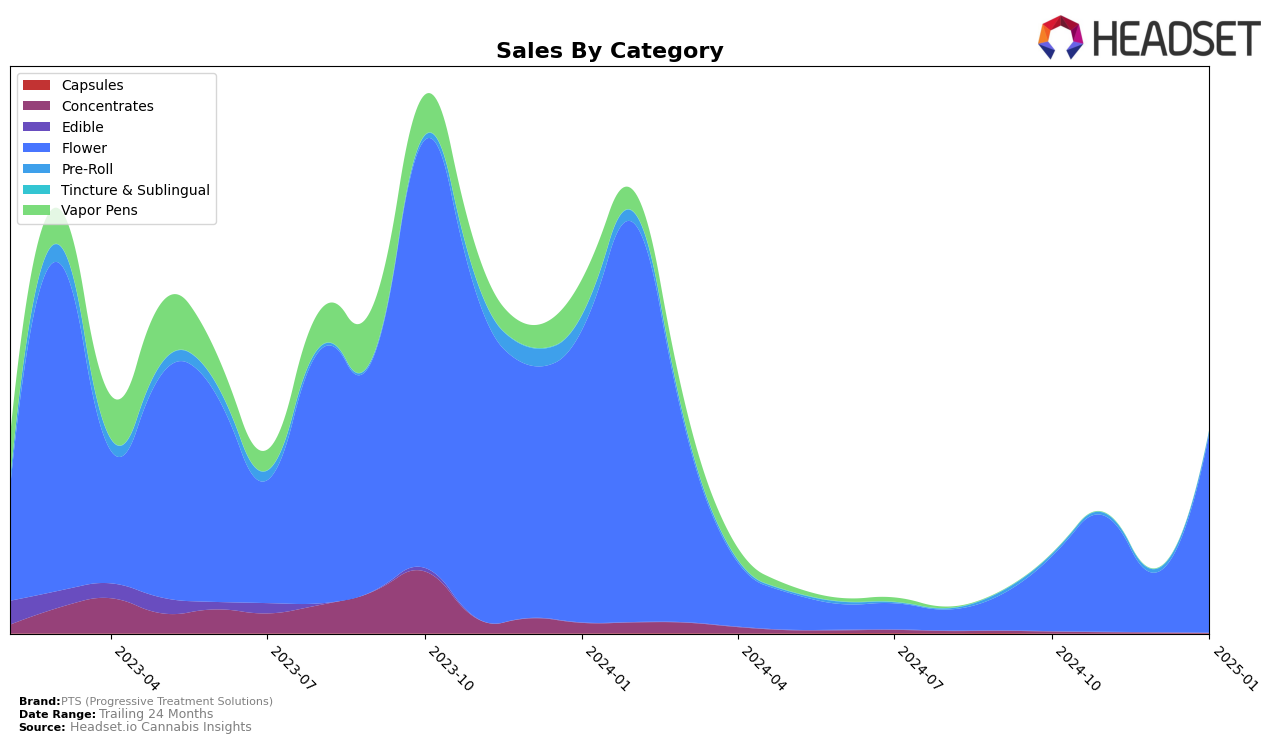
In the state of Arizona, PTS (Progressive Treatment Solutions) has shown a notable performance in the Flower category. Starting from a rank of 39 in October 2024, the brand made a significant leap to rank 28 in November, before slipping back to 39 in December. However, by January 2025, PTS made an impressive recovery, reaching the 20th position, which indicates a strong upward trend. This fluctuation in rankings suggests that while PTS faced some challenges in maintaining its position, its efforts to regain market share were successful, particularly in the new year.
Conversely, in Illinois, PTS's performance in the Flower category has been relatively stable but less dynamic. The brand's rank hovered around the mid-50s, ranging from 54 in October 2024 to 56 in January 2025, never breaking into the top 30. This consistency, albeit at a lower rank, might indicate a steady customer base but also highlights the competitive nature of the Illinois market, where PTS has not yet managed to significantly elevate its position. The sales figures reflect a similar pattern, with minor fluctuations suggesting that while there is room for growth, PTS has yet to make a substantial impact in Illinois compared to its performance in Arizona.
Competitive Landscape
In the competitive landscape of the Arizona flower category, PTS (Progressive Treatment Solutions) has shown a notable fluctuation in its ranking over the months from October 2024 to January 2025. Starting at a rank of 39 in October, PTS made a significant leap to rank 28 in November, only to fall back to 39 in December. However, January 2025 marked a substantial improvement as PTS climbed to rank 20, indicating a positive trend in its market presence. This upward movement is particularly significant when compared to competitors like 22Red, which maintained a relatively stable position around the 20th rank, and Aeriz, which showed a slight fluctuation but remained within the top 20. Meanwhile, Savvy consistently outperformed PTS, maintaining a top 19 position throughout the period. The data suggests that while PTS has faced challenges in maintaining a consistent rank, its recent surge in January could be indicative of strategic improvements or market shifts favoring its offerings, positioning it to potentially close the gap with more stable competitors in the Arizona flower market.

Notable Products
In January 2025, the top-performing product from PTS (Progressive Treatment Solutions) was Lemon Citron (3.5g) in the Flower category, which climbed to the number 1 rank with sales reaching 3771 units. Hella Jelly (14g) also made a significant impact, securing the 2nd position with a strong sales performance, despite not being ranked in previous months. Bismarck (14g) maintained a consistent presence, ranking 3rd in January 2025, a slight improvement from its 3rd place in November 2024 after leading in October 2024. Dream Queen (14g) entered the rankings at 4th place, showcasing its growing popularity. GSC (3.5g) experienced a drop from 4th in December 2024 to 5th in January 2025, indicating a shift in consumer preference within the Flower category.
Top Selling Cannabis Brands
Data for this report comes from real-time sales reporting by participating cannabis retailers via their point-of-sale systems, which are linked up with Headset’s business intelligence software. Headset’s data is very reliable, as it comes digitally direct from our partner retailers. However, the potential does exist for misreporting in the instance of duplicates, incorrectly classified products, inaccurate entry of products into point-of-sale systems, or even simple human error at the point of purchase. Thus, there is a slight margin of error to consider. Brands listed on this page are ranked in the top twenty within the market and product category by total retail sales volume.


