Mar-2025
Sales
Trend
6-Month
Product Count
SKUs
Overview
Market Insights Snapshot
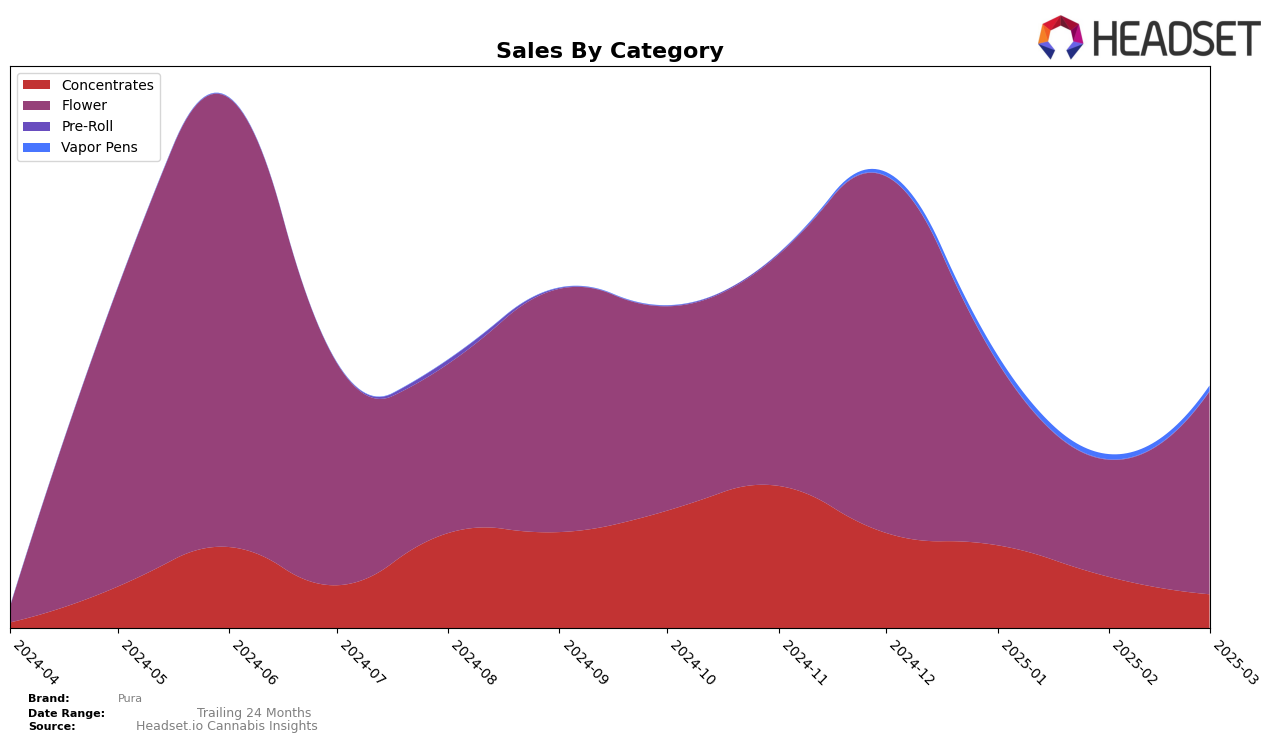
In the New York market, Pura's performance in the Concentrates category has shown a declining trend over the months from December 2024 to March 2025. Starting at the 10th position in December, Pura slipped to the 18th position by March. This downward movement indicates a significant challenge in maintaining their competitive edge in this category, as reflected in the decreasing sales figures, which fell from $91,157 to $32,161 over the same period. The drop in rankings is notable, especially as they have remained within the top 30, a threshold they managed to maintain, albeit with a declining trajectory.
Conversely, Pura's performance in the Flower category in New York shows some fluctuations. While they started at the 23rd position in December, they fell out of the top 30 in January and February, reaching a low of 59th, before climbing back to the 41st position in March. This rebound suggests some recovery efforts or changes in market dynamics that have allowed Pura to improve their standing. Although sales figures saw a dip in January and February, the increase to $194,887 in March indicates a positive turn. The ability to re-enter the top 50 could be a sign of strategic adjustments or changes in consumer preferences that benefitted Pura.
Competitive Landscape
In the competitive landscape of the flower category in New York, Pura has experienced notable fluctuations in its rank and sales over the past few months. Starting from a strong position in December 2024 with a rank of 23, Pura saw a significant drop to 40 in January 2025 and further down to 59 in February, before recovering slightly to 41 in March. This volatility contrasts with competitors like Zizzle, which maintained a relatively stable rank around the 30s, and Good Green, which consistently performed better, holding ranks in the 30s and even reaching 31 in January. High Peaks and CAM also showed more stability, with High Peaks improving to 42 by March. Pura's sales mirrored its rank changes, initially leading with higher sales but experiencing a decline in January and February, before a rebound in March. This suggests that while Pura has the potential to perform well, it faces challenges in maintaining consistent market presence amidst strong and stable competitors.

Notable Products
In March 2025, Pura's top-performing product was Oreoz x Purple Punch (0.7g) in the Flower category, maintaining its consistent first-place ranking from January and February, despite a decrease in sales to 325 units. The Oreoz x Purple Punch (3.5g) emerged as a strong contender, securing the second position. Mimosa Sugar Wax (1g) in the Concentrates category dropped to third place from its second position in February, with sales figures reflecting this shift. RS-11 x Soap (3.5g) and Banana Cream Cake (3.5g) rounded out the top five, ranking fourth and fifth, respectively, marking their first appearances in the rankings for March. This reshuffling highlights a dynamic market where new products are gaining traction alongside established favorites.
```Top Selling Cannabis Brands
Data for this report comes from real-time sales reporting by participating cannabis retailers via their point-of-sale systems, which are linked up with Headset’s business intelligence software. Headset’s data is very reliable, as it comes digitally direct from our partner retailers. However, the potential does exist for misreporting in the instance of duplicates, incorrectly classified products, inaccurate entry of products into point-of-sale systems, or even simple human error at the point of purchase. Thus, there is a slight margin of error to consider. Brands listed on this page are ranked in the top twenty within the market and product category by total retail sales volume.

