.svg)

Sep-2026
Sales
Trend
6-Month
Product Count
SKUs
Avg Price
YoY Sales Change
YoY Price Change


Where to Buy
Rebel Edibles is stocked at 85 licensed dispensaries across Colorado, with the deepest coverage in Denver, Colorado Springs, Fort Collins, Aurora, and Longmont. Search by ZIP code or city below to find the closest one, or filter by product type if you are after a specific format.
Market Insights Snapshot
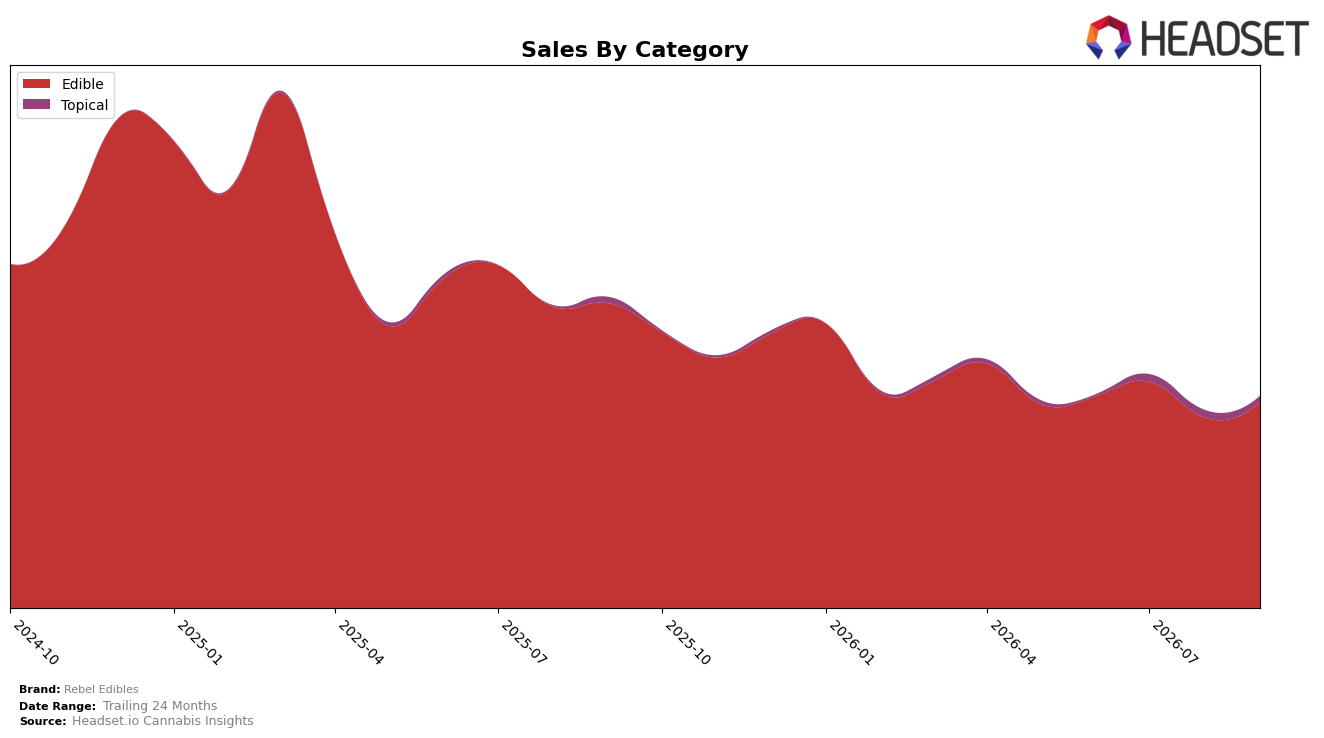
In September 2026, Rebel Edibles concentrated 97.22% of sales in Edible, with Topical at 2.78%, indicating a narrow category mix despite a brand-level year-over-year decline of 31.91% and a 24‑month change of 22.23% down. Within Edible, sales were down 32.50% year over year but up 8.10% month over month, while Topical declined 1.93% year over year and fell 19.09% month over month; average prices diverged at $11.17 in Edible versus $25.42 in Topical, alongside a 1.78% brand-level average price increase. The pattern implies short‑term momentum is concentrated in the core Edible line even as the narrow mix magnifies exposure to Edible’s YoY contraction.
With Edible accounting for 97.22% share and holding a rank of 17 in Edible in Colorado, the mix suggests Rebel Edibles is positioned as a depth player rather than a portfolio balancer, using month-over-month Edible growth of 8.10% to defend placement while accepting a 32.50% YoY drag in the same category. The 2.78% Topical share, paired with a 19.09% month-over-month drop and a smaller 1.93% YoY decline, implies that peripheral categories are not yet scaled enough to offset Edible cyclicality; the strategy likely prioritizes price-stable ($11.17 vs. $25.42) velocity in Edible over diversification, which confines competitive movement to rank efficiency within Edible rather than cross-category insulation.
Competitive Landscape
Rebel Edibles sits at rank #17 in CO Edible for September 2026, improving 1 position from #18 year over year, while holding flat versus three months ago at #18 and remaining below its peak of #11 from January 2025; in contrast, Wana moved up from #2 to #1 with a 10.5% sales gain year over year and Wyld slipped from #1 to #2 alongside a 23.8% sales decline, indicating Rebel Edibles’ incremental rank uptick is occurring amid leadership reshuffling at the top. This pattern—minor rank improvement (+1 YoY) alongside stable near-term positioning (no change versus June 2026) while top competitors trade places—implies Rebel Edibles is treading water in the mid-tier and will need a sharper share shift to convert turbulence above into sustained rank ascent.

Notable Products
Sativa Pebbles Coated Gummies 10-Pack (100mg) delivered the headline move in September 2026 with a 64.6% month-over-month surge to rank 5, while Sativa Strawberry Orange Pebble Bites Gummies 10-Pack (100mg) fell 34.3% to rank 3. Indica Blue Raspberry Pebbles Gummies 10-Pack (100mg) held rank 1 with an 18.9% MoM increase and approximately $33,203 in sales, as the Hybrid Strawberry, Green Apple, Blue Raspberry, and Mango Coated Gummies 10-Pack (100mg) climbed 41.5% to rank 2. With at least four of the top ten anchored in Pebbles or coated gummy formats, momentum is consolidating around coated gummy textures and blue-raspberry flavor cues, implying Rebel Edibles is tilting assortment and demand capture toward candy-style gummies rather than caramels or novel rosin lines.
Top Selling Cannabis Brands






Data for this report comes from real-time sales reporting by participating cannabis retailers via their point-of-sale systems, which are linked up with Headset’s business intelligence software. Headset’s data is very reliable, as it comes digitally direct from our partner retailers. However, the potential does exist for misreporting in the instance of duplicates, incorrectly classified products, inaccurate entry of products into point-of-sale systems, or even simple human error at the point of purchase. Thus, there is a slight margin of error to consider. Brands listed on this page are ranked in the top twenty within the market and product category by total retail sales volume.

