.svg)

Sep-2026
Sales
Trend
6-Month
Product Count
SKUs
Avg Price
YoY Sales Change
YoY Price Change


Where to Buy
Remedi is stocked at 253 licensed dispensaries across Illinois, Pennsylvania, and 3 other states, 129 of them in Illinois, with the deepest coverage in Chicago, Normal, Schaumburg, Springfield, and Champaign. Search by ZIP code or city below to find the closest one, or filter by product type if you are after a specific format.
Market Insights Snapshot
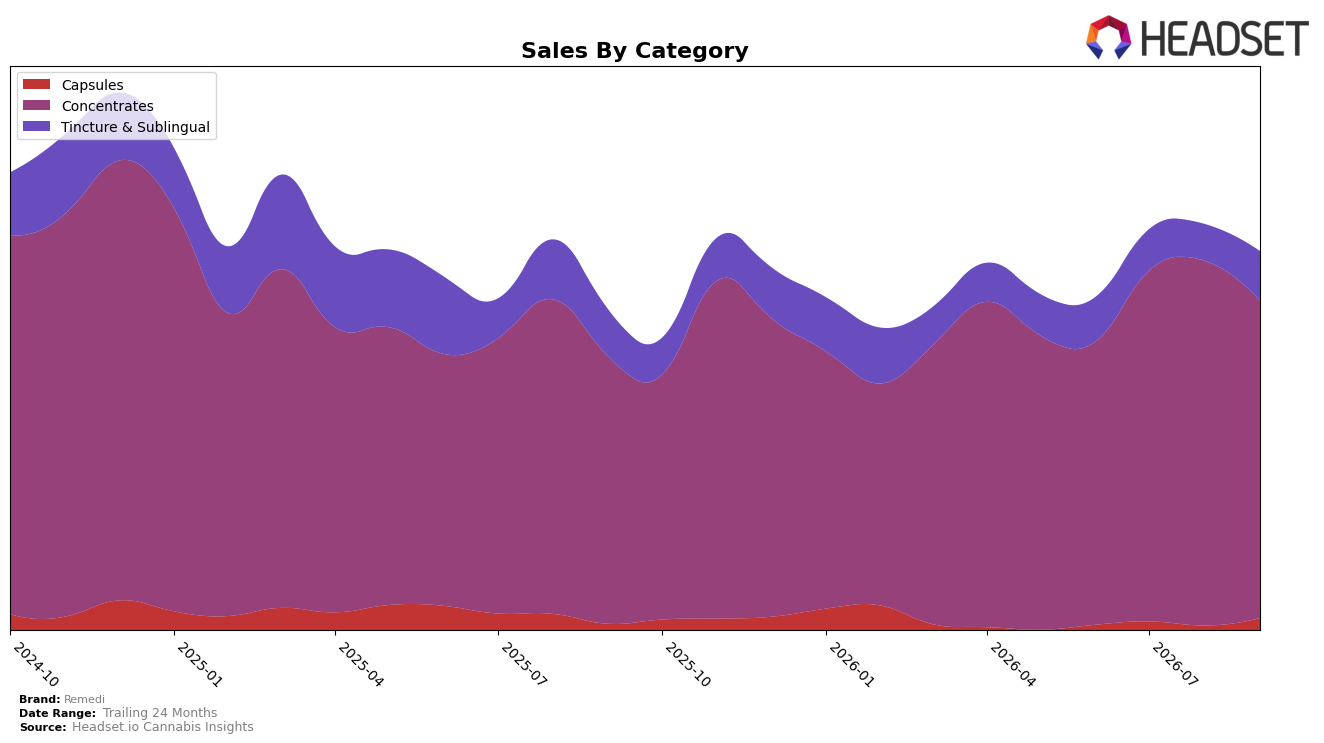
In September 2026, Remedi’s category mix is concentrated, with Concentrates holding 82.15% share at a year-over-year change of 18.51% and a month-over-month drop of 12.82%, while Tincture & Sublingual sits at 13.72% share with 4.74% YoY growth and a 31.08% MoM increase. Capsules remain small at 4.14% share but post a 54.83% YoY rise and an 84.57% MoM surge; alongside an overall average price decline of 6.76% YoY to $21.38, this spread suggests volume-led gains. The net effect is a portfolio pivot where rapid MoM gains in Tincture & Sublingual and Capsules offset Concentrates’ MoM pullback, implying mix diversification despite Concentrates’ outsized weight and Remedi’s 17.53% brand-level YoY sales growth.
These shifts position Remedi to hedge category risk: dependence on Concentrates (ranked 20 in Illinois) is tempered by faster-growing Capsules and a double-digit MoM lift in Tincture & Sublingual, indicating emerging levers beyond a single flagship. With Concentrates still providing scale at 82.15% share and Tincture & Sublingual plus Capsules jointly contributing 17.86% share, the brand’s lower pricing and divergent growth rates point to a value-access strategy that can improve rank exposure if non-Concentrates sustain 31.08% and 84.57% MoM momentum; the thesis is that Remedi’s near-term positioning improves as share rebalances away from a category with negative MoM while preserving double-digit YoY tailwinds.
Competitive Landscape
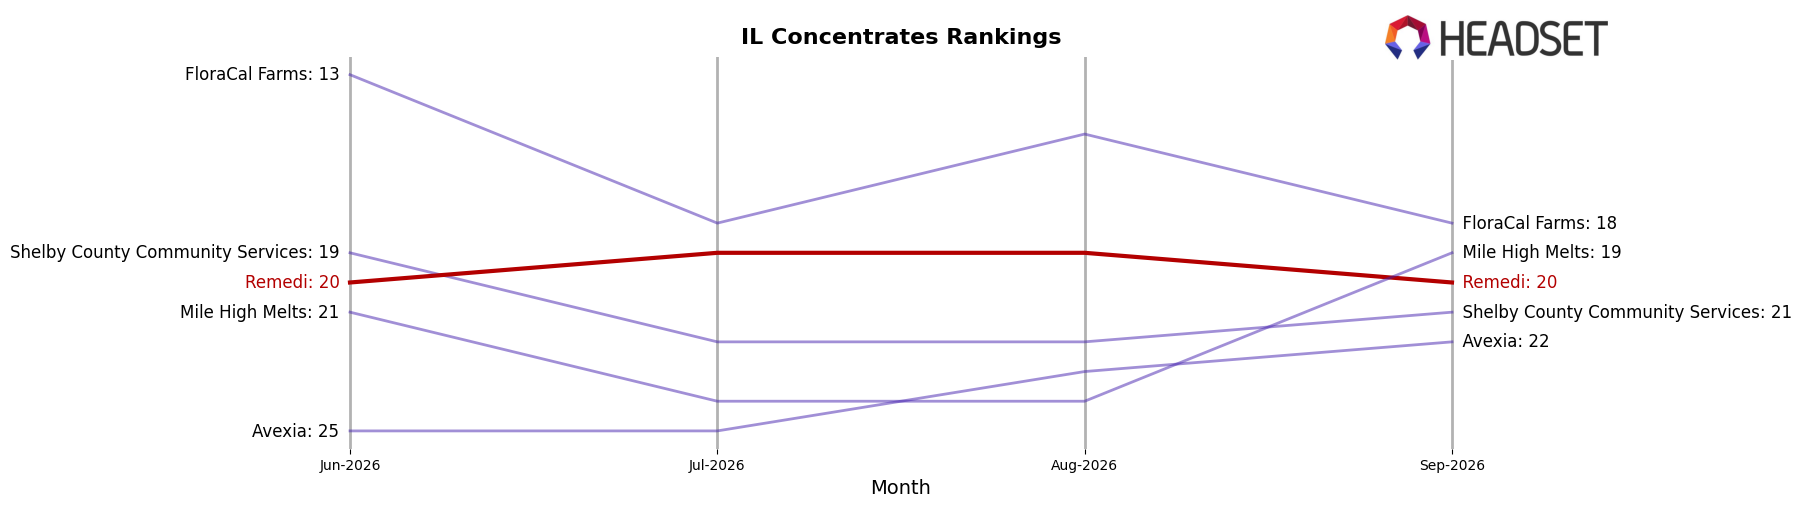
Remedi ranks #20 in Illinois Concentrates in September 2026, improving 4 positions YoY from #24 and holding flat versus June 2026 at #20, while its peak position of #19 in August 2026 was a 1-rank gain that proved temporary. Against the leaders, Aeriz held #1 YoY with a 12.9% sales increase and IC Collective climbed from #5 to #3 with 90.0% YoY growth, indicating upward mobility near the top even as Remedi’s movement was limited to a 1-rank peak and a 4-position YoY rise. This pattern implies Remedi is stabilizing in the lower top-20 with incremental gains, while faster-moving competitors consolidate share above it, signaling that without a step-change in velocity Remedi’s rank trajectory is likely to plateau around the high-teens to #20 range.
Notable Products
CBD/THC 1:5 Rest Capsules 20-Pack (20mg CBD, 100mg THC) posted the largest move in September 2026 with a 129.9% month-over-month gain and entered the top ten at rank 9, while CBD/THC 1:1 Relief Tincture (50mg CBD, 50mg THC, 30ml) climbed 58.4% to rank 4 off approximately $9.6k in sales. In contrast, Indica Rest RSO Dropper (0.5g) fell 27.4% and slid behind the lead Concentrates positions where Indica Relief RSO Syringe (0.5g) held rank 1 with an 8.0% decline and Indica Rest RSO Syringe (0.5g) at rank 2 contracted 9.4%. With eight of the top ten anchored in Concentrates but the only triple-digit growth coming from Capsules and the strongest uptick within Tincture & Sublingual, the mix implies early demand rotation toward measured-dose, wellness-leaning formats alongside a still-dominant RSO base.
Top Selling Cannabis Brands






Data for this report comes from real-time sales reporting by participating cannabis retailers via their point-of-sale systems, which are linked up with Headset’s business intelligence software. Headset’s data is very reliable, as it comes digitally direct from our partner retailers. However, the potential does exist for misreporting in the instance of duplicates, incorrectly classified products, inaccurate entry of products into point-of-sale systems, or even simple human error at the point of purchase. Thus, there is a slight margin of error to consider. Brands listed on this page are ranked in the top twenty within the market and product category by total retail sales volume.

