Oct-2024
Sales
Trend
6-Month
Product Count
SKUs
Overview
Market Insights Snapshot
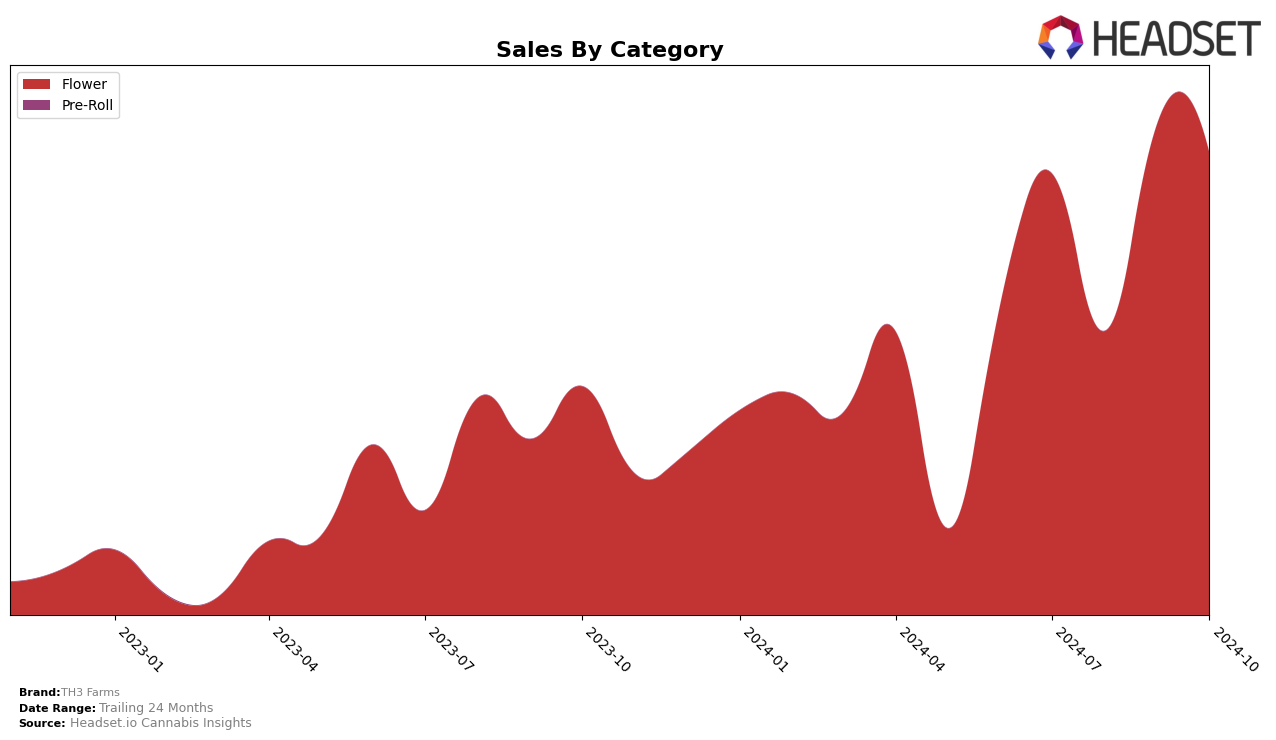
TH3 Farms has experienced fluctuating performance across different states and categories, particularly in the Flower category in Oregon. In July 2024, TH3 Farms ranked 27th in Oregon, which marked a notable presence in the top 30 brands. However, by August, the brand had slipped out of the top 30, ranking 51st, indicating a challenging month. The brand rebounded in September, climbing back to 26th place, before slightly dropping to 28th in October. Such volatility may suggest competitive pressures or seasonal variations impacting the Flower category in Oregon.
Despite the ranking fluctuations, TH3 Farms demonstrated resilience in sales figures in Oregon. Although there was a dip in August, where sales fell to $159,907, the brand saw a recovery in September with sales jumping to $278,212. This rebound suggests effective strategies or market conditions that favored the brand's offerings in that period. The slight decrease in October sales to $260,347 still reflects a strong position compared to August, indicating that while rankings may vary, the brand maintains a solid sales foundation. This performance pattern in Oregon could provide insights into TH3 Farms' market adaptability and category dynamics.
Competitive Landscape
In the competitive landscape of the Oregon flower market, TH3 Farms has experienced fluctuating rankings over the past few months, indicating a dynamic market position. In July 2024, TH3 Farms held the 27th rank, but it slipped to 51st in August before rebounding to 26th in September and slightly dropping to 28th in October. This volatility contrasts with the steady rise of Cultivated Industries, which climbed from 85th in July to 29th in October, suggesting a significant increase in market share. Meanwhile, Oregrown maintained a relatively stable position, ending October at 30th, while Frontier Farms saw a decline from 14th in August to 26th in October, indicating potential challenges in sustaining their earlier momentum. Bald Peak also showed improvement, moving from 50th in July to 27th in October. These shifts highlight the competitive pressures TH3 Farms faces, as brands like Cultivated Industries and Bald Peak gain traction, potentially impacting TH3 Farms' sales and market strategy.

Notable Products
In October 2024, the top-performing product from TH3 Farms was Popz (3.5g) in the Flower category, maintaining its number 1 rank from September with sales of 1716 units. Sugar Skull (3.5g) rose to the second position, improving from third place in September, with a notable increase in sales. Paradise Cookies (3.5g) entered the rankings at the third spot, showing strong sales performance in its debut month. Grape Ice (3.5g) and Grape Iced Cookie (3.5g) secured the fourth and fifth positions, respectively, both entering the rankings for the first time. The consistent top ranking of Popz (3.5g) and the upward movement of Sugar Skull (3.5g) highlight TH3 Farms' dominance in the Flower category for October.
Top Selling Cannabis Brands
Data for this report comes from real-time sales reporting by participating cannabis retailers via their point-of-sale systems, which are linked up with Headset’s business intelligence software. Headset’s data is very reliable, as it comes digitally direct from our partner retailers. However, the potential does exist for misreporting in the instance of duplicates, incorrectly classified products, inaccurate entry of products into point-of-sale systems, or even simple human error at the point of purchase. Thus, there is a slight margin of error to consider. Brands listed on this page are ranked in the top twenty within the market and product category by total retail sales volume.


