Feb-2026
Sales
Trend
6-Month
Product Count
SKUs
Avg Price
YoY Sales Change
YoY Price Change
Market Insights Snapshot
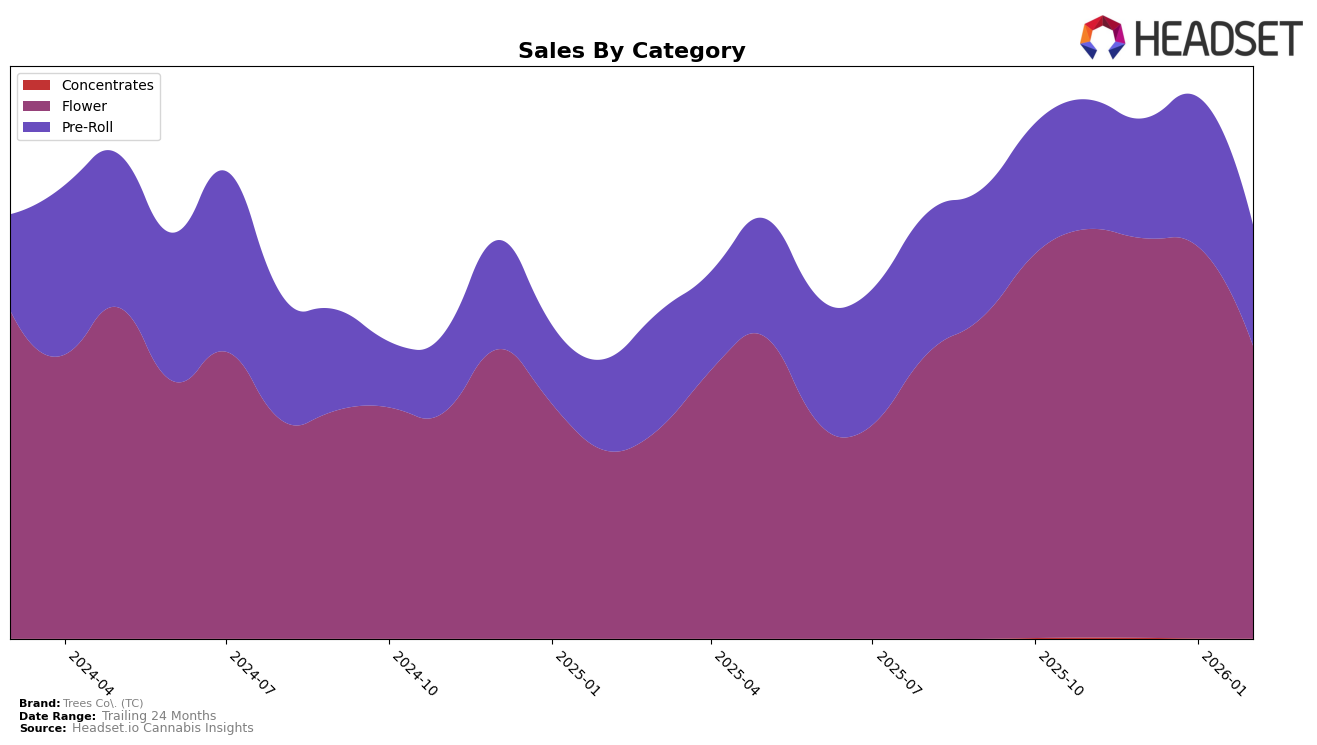
In the state of Massachusetts, Trees Co. (TC) has experienced fluctuating performance across different cannabis categories. In the Flower category, TC maintained a steady position in November and December of 2025, ranking 20th. However, by February 2026, the brand's rank slipped to 26th, indicating a downward trend. This decline is further underscored by a notable decrease in sales from November 2025 to February 2026. In contrast, the Pre-Roll category showed some positive movement, with TC climbing from 34th place in December 2025 to 28th in January 2026, before settling at 33rd in February. This indicates some volatility but also suggests potential resilience in the Pre-Roll market.
The shifting ranks in Massachusetts highlight the competitive nature of the cannabis market, particularly in the Flower and Pre-Roll categories. The fact that Trees Co. (TC) did not make it into the top 30 brands in the Pre-Roll category in December 2025 could be seen as a setback, but the subsequent improvement in January 2026 suggests that the brand is capable of recovering lost ground. This dynamic is crucial for stakeholders to consider when evaluating TC's market strategy and potential for growth in this state. The data suggests that while there are challenges, there are also opportunities for Trees Co. to capitalize on, especially if they can stabilize their performance in the Flower category and continue to improve in Pre-Rolls.
Competitive Landscape
In the Massachusetts flower category, Trees Co. (TC) has experienced notable fluctuations in its competitive positioning over recent months. Starting from a rank of 20th in November 2025, TC maintained this position in December but saw a slight drop to 21st in January 2026, followed by a more significant decline to 26th in February. This downward trend in rank is mirrored by a decrease in sales, particularly in February, where sales fell sharply. In contrast, Nature's Heritage showed resilience by improving its rank from 29th in November to 24th in both December and February, indicating a recovery in sales after a dip in January. Meanwhile, Commcan maintained a relatively stable position, with only minor fluctuations in rank, suggesting a more consistent sales performance. Bostica, which started ahead of TC in November, experienced a similar downward trend, dropping from 19th to 25th by February, although it managed to stay ahead of TC. These dynamics highlight the competitive pressures TC faces, particularly from brands like Nature's Heritage, which are successfully rebounding and potentially capturing market share.

Notable Products
In February 2026, the top-performing product for Trees Co. (TC) was Loud Candy Cream Pre-Roll (1g) in the Pre-Roll category, achieving the number one rank with sales of 3263 units. Following closely, So F'n Gassy Pre-Roll (1g) secured the second position, a notable rebound from its absence in January 2026, with sales reaching 2804 units. Eager Beaver Pre-Roll (1g) made its debut in the rankings at the third position, indicating a strong entry into the market. Melonade Gibson Pre-Roll (1g), which was the leader in January, slipped to fourth, showing a decrease in sales from 5243 to 2533 units. Cadillac Mac Pre-Roll (1g) rounded out the top five, maintaining its position from the previous month.
Top Selling Cannabis Brands
Data for this report comes from real-time sales reporting by participating cannabis retailers via their point-of-sale systems, which are linked up with Headset’s business intelligence software. Headset’s data is very reliable, as it comes digitally direct from our partner retailers. However, the potential does exist for misreporting in the instance of duplicates, incorrectly classified products, inaccurate entry of products into point-of-sale systems, or even simple human error at the point of purchase. Thus, there is a slight margin of error to consider. Brands listed on this page are ranked in the top twenty within the market and product category by total retail sales volume.

