Jun-2026
Sales
Trend
6-Month
Product Count
SKUs
Avg Price
YoY Sales Change
YoY Price Change
Market Insights Snapshot
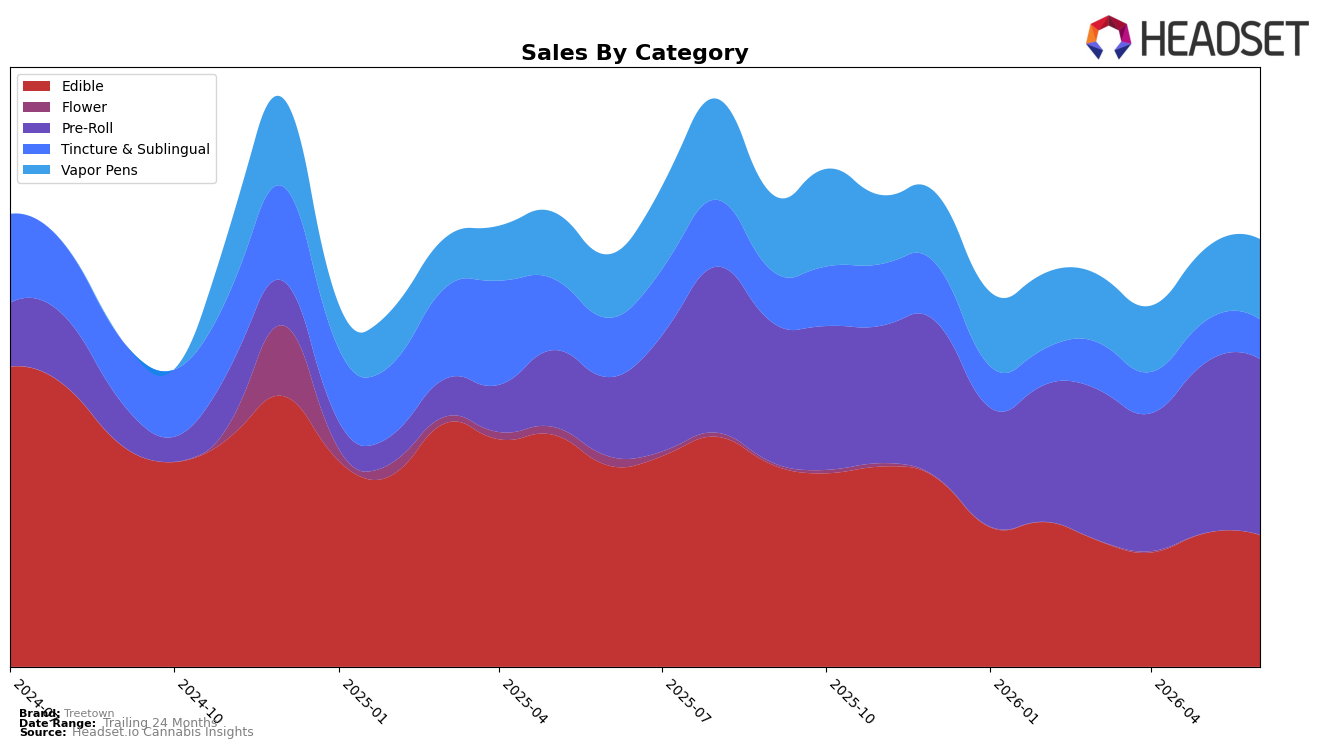
In June 2026, Treetown’s mix pivoted toward Pre-Roll, which carried 41.18% share with 122.81% year-over-year growth and 3.58% month-over-month, while Edible fell to 30.85% share with -34.61% year-over-year and -1.22% month-over-month. Vapor Pens expanded to 18.74% share with 26.40% year-over-year and 10.90% month-over-month, whereas Tincture & Sublingual slipped to 9.23% share with -33.28% year-over-year and -5.27% month-over-month. With brand-level sales up 3.70% year-over-year but down 3.78% over 24 months, the mix shift implies Treetown is trading into faster-moving inhalables to offset declines in ingestibles.
The tilt toward higher-velocity inhalables coincides with a 57.87% average price increase and a June 2026 Pre-Roll rank of 71 in Michigan, indicating price-led repositioning that depends on maintaining visibility within a crowded tier. Vapor Pens’ double-digit month-over-month growth of 10.90% alongside Pre-Roll’s 3.58% month-over-month creates a two-pillar entry path, while Edible’s -34.61% year-over-year and Tincture & Sublingual’s -33.28% year-over-year compress breadth; the pattern implies Treetown’s near-term share will hinge on sustaining Pre-Roll velocity while Vapor Pens absorb lapsing ingestible demand.
Competitive Landscape
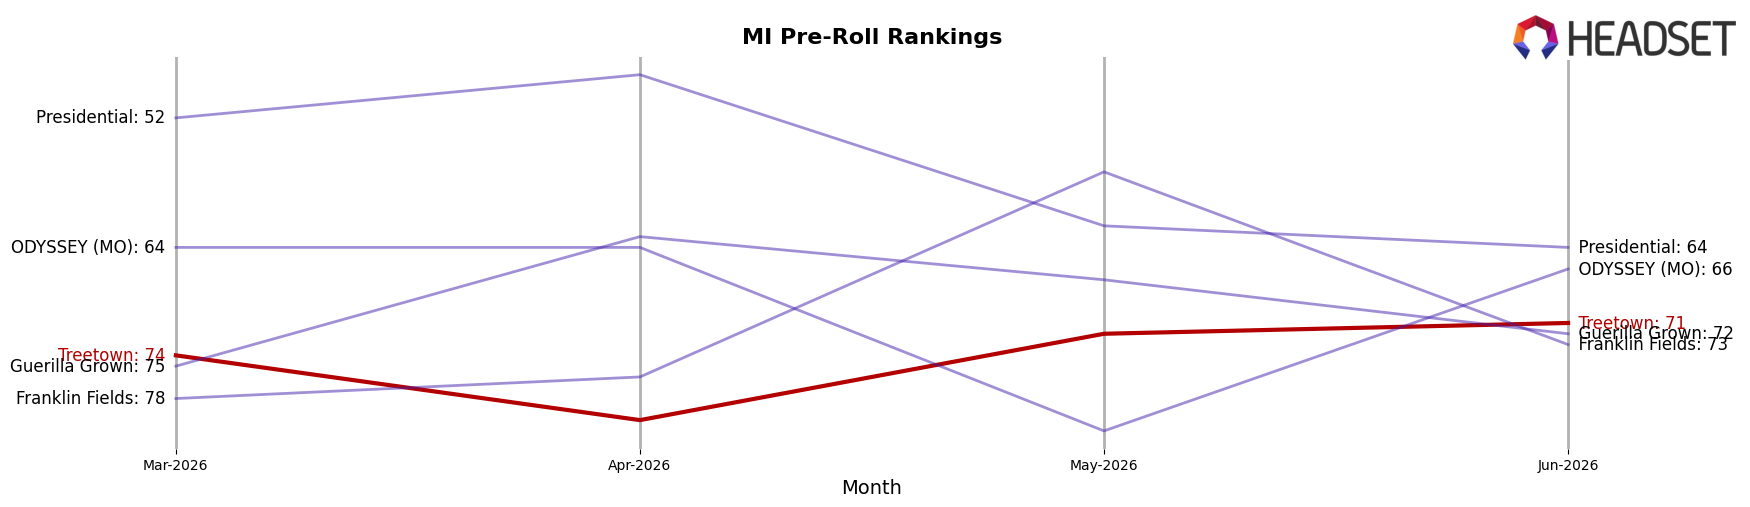
Treetown sits at rank 71 in MI Pre-Roll in June 2026, improving 32 positions from rank 103 year over year, while edging 3 spots better than March 2026’s rank 74; despite peaking at rank 70 in August 2025, the current position is 1 place off that peak, indicating modest recapture of prior placement. At the top end, Jeeter held at rank 1 year over year with a 7.9% sales decline, and Mitten Extracts advanced from rank 8 to rank 4 with 114.4% sales growth, signaling that upward mobility is possible even as Cali-Blaze stayed at rank 2 alongside a 33.1% sales contraction. The pattern implies Treetown’s 32-rank YoY climb and near-peak proximity position it for incremental share capture if it converts slight quarter-over-quarter rank gains into sustained movement against incumbents with flat or declining momentum.
Notable Products
CBD/THC 2:1 Tranquil Dragonfruit Gummies 10-Pack (100mg CBD, 50mg THC) posted the steepest decline at -29.9% and fell to rank 10, while CBD/THC 1:2 Euphoria Melon Gummies 10-Pack (50mg CBD, 100mg THC) dropped -28.5% at rank 6, indicating demand rotated away from lower-THC-balancing formulas in June 2026. In contrast, Euphoria - THC/CBD 2:1 Magic Melon Distillate Disposable (1g) climbed +26.9% to rank 9 and Sleep - CBN/THC 2:1 Blackberry Lavender Gummies 10-Pack (100mg CBN, 50mg THC) rose +23.7% at rank 1, pointing to momentum in effect-led SKUs over general wellness blends. Eight of the top ten are Edible SKUs, but the single Vapor Pens entry advanced in rank as several Edibles slipped between -3.7% and -29.9%, suggesting Treetown’s mix is tilting toward differentiated need-states and a modest diversification beyond gummies. The $31,432 result for the leading Sleep - CBN/THC 2:1 Blackberry Lavender Gummies 10-Pack (100mg CBN, 50mg THC), alongside a -0.7% to +11.3% mid-pack spread and a -29.9% tail, implies June 2026 favored targeted formulations and leaves room to seed fast-follow formats adjacent to the Sleep and Euphoria platforms.
Top Selling Cannabis Brands
Data for this report comes from real-time sales reporting by participating cannabis retailers via their point-of-sale systems, which are linked up with Headset’s business intelligence software. Headset’s data is very reliable, as it comes digitally direct from our partner retailers. However, the potential does exist for misreporting in the instance of duplicates, incorrectly classified products, inaccurate entry of products into point-of-sale systems, or even simple human error at the point of purchase. Thus, there is a slight margin of error to consider. Brands listed on this page are ranked in the top twenty within the market and product category by total retail sales volume.

