.svg)

Sep-2026
Sales
Trend
6-Month
Product Count
SKUs
Avg Price
YoY Sales Change
YoY Price Change


Market Insights Snapshot
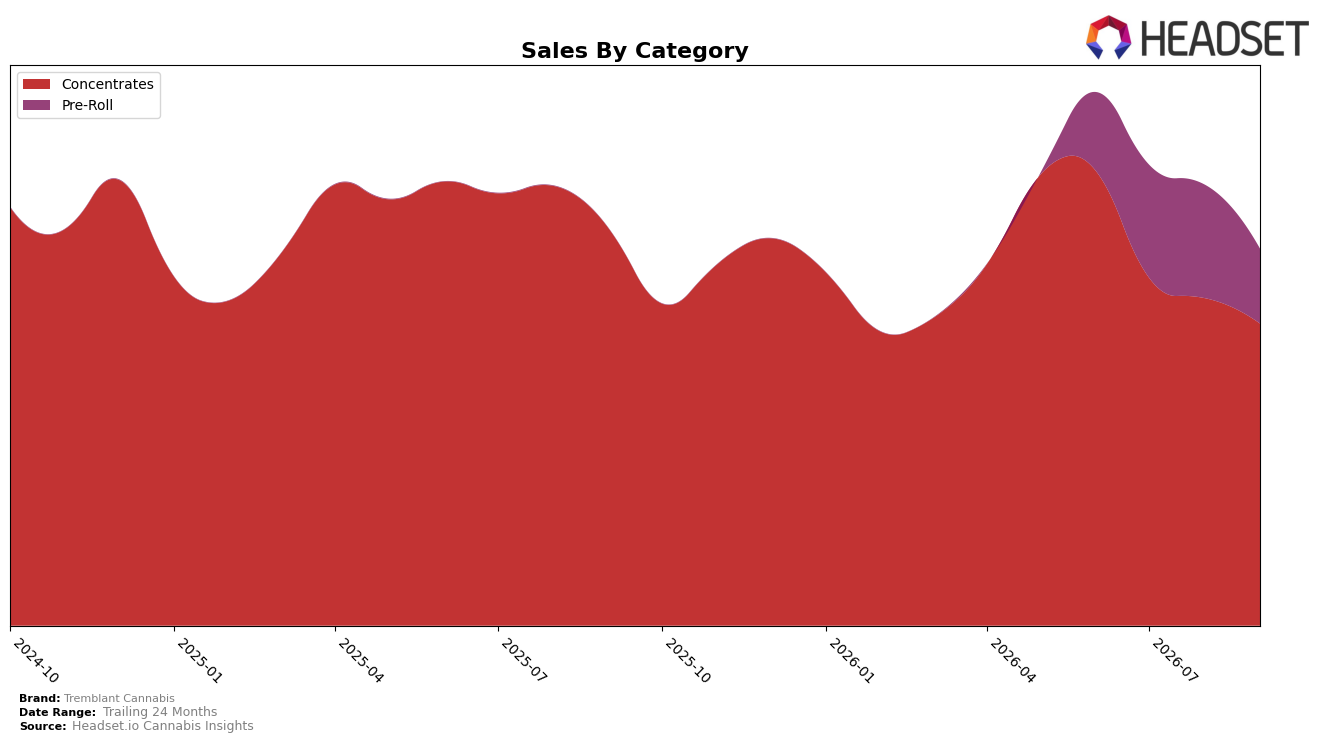
In September 2026, Tremblant Cannabis concentrated 80.19% of sales in Concentrates while Pre-Roll held 19.81%, a split that tightened as Concentrates declined 24.09% year over year and 7.77% month over month, while Pre-Roll fell 34.13% month over month off a smaller base. Despite average price down 4.67% year over year to $30.43, overall brand sales contracted 5.34% year over year and 13.98% over 24 months, and Concentrates rank in Ontario sat at 11; the pattern implies the mix is overexposed to a contracting core category where price cuts are not offsetting volume softness.
The sharper month-over-month pullback in Pre-Roll at 34.13% versus 7.77% in Concentrates, combined with an 80.19% share anchored in Concentrates and a #11 rank in Ontario Concentrates, implies positioning dominated by a single-category identity that limits defensive flexibility. With brand-average pricing only 4.67% lower year over year alongside a 24.09% Concentrates decline and a 5.34% total sales decline, the gap suggests demand elasticity is muted and that stabilizing share likely requires mix diversification rather than incremental price moves.
Competitive Landscape
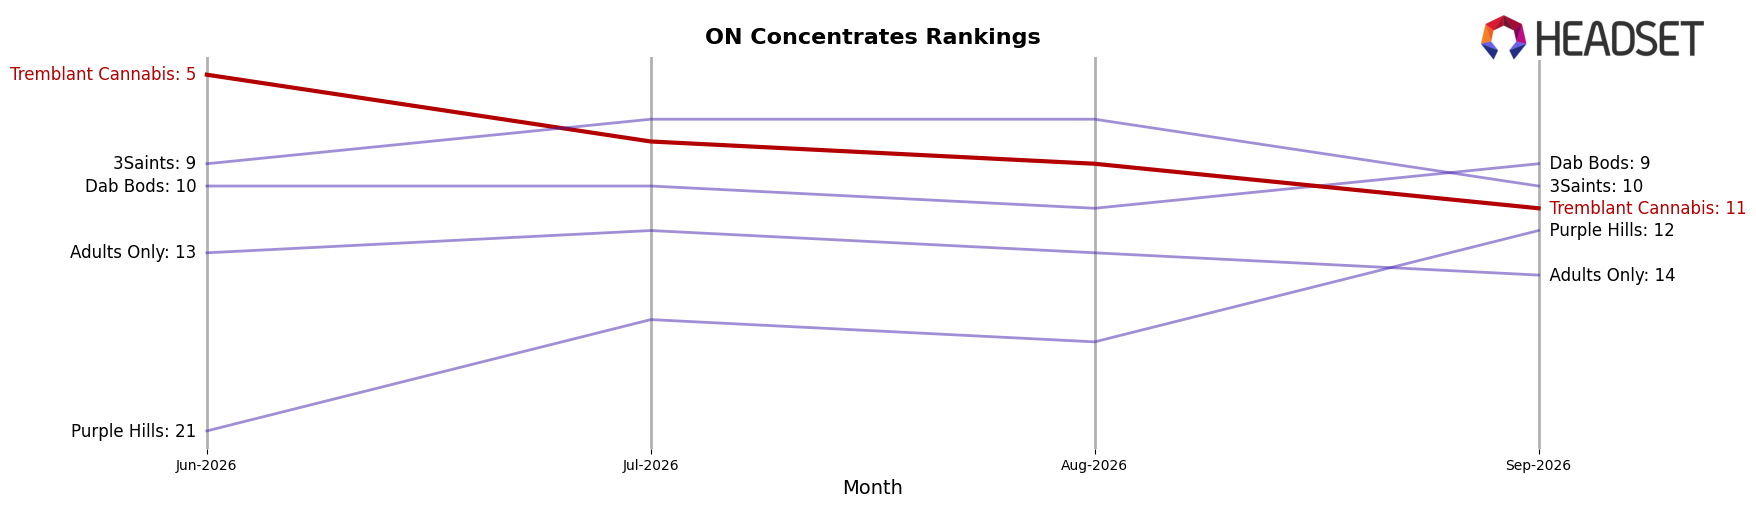
Tremblant Cannabis ranks #11 in ON Concentrates in September 2026, down 5 positions year over year from #6, and 6 positions below its June 2026 peak of #5; versus three months ago in June 2026, the brand slipped from #5 to #11. In contrast, BoxHot rose from #9 to #5 year over year while reporting a 52.3% sales increase, and category leader Vortex Cannabis Inc. held #1 year over year despite a 13.0% sales decline. The pattern implies Tremblant Cannabis is ceding rank to faster-rising competitors despite softness at the top, signaling a need to reverse mid-year momentum loss.
Notable Products
The steepest decline came from High Alpine Hash (2g), down 77.7% month over month to $307 and sitting at rank 9, while Pure Moroccan Hash Infused Pre-Roll 3-Pack (1.5g) fell 34.8% at rank 2. Hashish (2g) held rank 1 with a 2.5% MoM increase, as Afghani Black Hash (2g) slid 39.1% at rank 3. With seven of the top ten SKUs in Concentrates and multiple double‑digit drops alongside a single modest gain at the top, the mix implies over-reliance on legacy hash formats that are concentrating volume in one flagship while exposing vulnerability across the rest of the lineup.
Top Selling Cannabis Brands






Data for this report comes from real-time sales reporting by participating cannabis retailers via their point-of-sale systems, which are linked up with Headset’s business intelligence software. Headset’s data is very reliable, as it comes digitally direct from our partner retailers. However, the potential does exist for misreporting in the instance of duplicates, incorrectly classified products, inaccurate entry of products into point-of-sale systems, or even simple human error at the point of purchase. Thus, there is a slight margin of error to consider. Brands listed on this page are ranked in the top twenty within the market and product category by total retail sales volume.

