.svg)

Sep-2026
Sales
Trend
6-Month
Product Count
SKUs
Avg Price
YoY Sales Change
YoY Price Change


Market Insights Snapshot
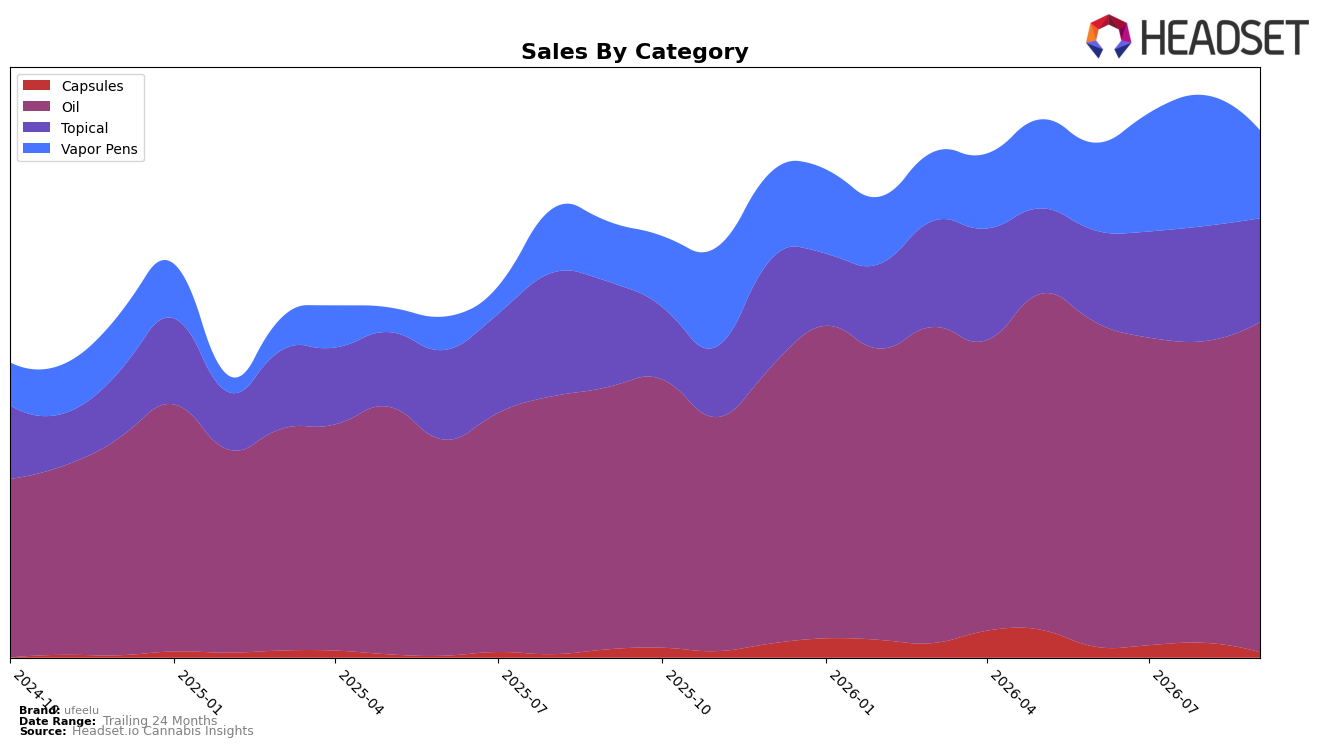
ufeelu’s category mix in September 2026 concentrated further into Oil at 61.55% share, with Oil up 25.45% year over year and 9.30% month over month, while Vapor Pens held 16.91% share with a 43.49% year-over-year lift but a 31.84% month-over-month drop. Topical accounted for 19.84% share with a 1.32% year-over-year decline and a 9.44% month-over-month decline, and Capsules fell to 1.70% share with a 24.67% year-over-year decline and a 50.69% month-over-month decline; average price moved 2.45% higher year over year to $41.57. With Oil also ranking number 1 in the Oil category in Saskatchewan and Ontario as the top province by sales, the pattern implies ufeelu is anchoring growth in core Oil while trading off near-term momentum in Vapor Pens and compressing its smaller formats.
The sharp divergence—Oil up 25.45% year over year versus Vapor Pens up 43.49% year over year but down 31.84% month over month—suggests ufeelu is capturing repeat demand in Oil while episodic volatility in inhalables reduces near-term mix contribution; combined with Topical’s 9.44% month-over-month decline and Capsules’ 50.69% month-over-month drop, the mix is tilting toward fewer, higher-velocity SKUs. The 2.45% year-over-year average price increase alongside Oil’s 9.30% month-over-month growth indicates pricing power is being absorbed primarily in Oil, implying the brand’s positioning is consolidating around an Oil-led value proposition where stability and rank leadership outweigh breadth, with reduced exposure to smaller, price-sensitive subcategories.
Competitive Landscape
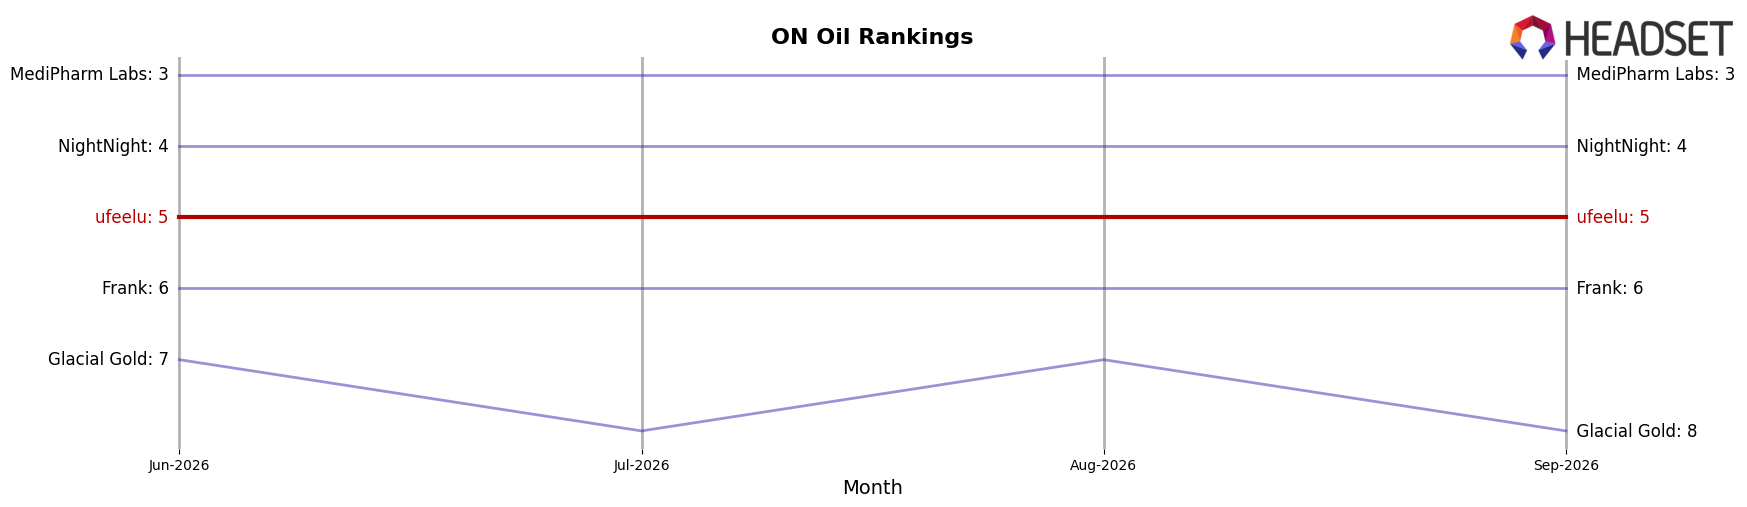
ufeelu is ranked #5 in ON Oil in September 2026, improving 1 position from #6 year over year, while holding flat versus June 2026 at #5; this places the brand at its peak rank of #5 in September 2026, indicating a ceiling that has yet to shift upward. In contrast, Mod stayed at #1 with a 3.2% year-over-year sales increase and Redecan held #2 despite a 21.2% year-over-year sales decline, suggesting that top-tier incumbents can retain rank even amid negative growth. Given ufeelu’s 1-rank YoY gain to #5 alongside a stable #5 three months ago, the trajectory implies incremental share capture but constrained mobility unless displacement occurs among the entrenched #1–#4 positions.
Notable Products
Hi Feel U Dream Live Resin Disposable (1g) posted the steepest decline at -59.5% and slid to rank 9, while Lavender Acai Tea Live Resin Disposable (1g) also fell -27.5% at rank 4. CBN/CBD 3:1 Relief Drops (30ml) held rank 1 with +9.0% MoM as CBD/CBG 3:1 Calm Drops (30ml) climbed +31.3% at rank 3, and CBD/CBG/CBN 2:1:1 Dream Drops (30ml) jumped +43.6% at rank 7. Four of the top ten are Oil SKUs clustered in ranks 1, 3, 5, and 7, and combined movement features one double-digit gain above +30% and two declines near or above -9%, indicating stabilization in Oils even as Vapor Pens contract. This pattern implies ufeelu’s mix is tilting toward functional Oils as the commercial priority, with Vapor Pens de-emphasized in September 2026 despite isolated revenue pockets like $32,579 for Lavender Acai Tea Live Resin Disposable (1g).
Top Selling Cannabis Brands






Data for this report comes from real-time sales reporting by participating cannabis retailers via their point-of-sale systems, which are linked up with Headset’s business intelligence software. Headset’s data is very reliable, as it comes digitally direct from our partner retailers. However, the potential does exist for misreporting in the instance of duplicates, incorrectly classified products, inaccurate entry of products into point-of-sale systems, or even simple human error at the point of purchase. Thus, there is a slight margin of error to consider. Brands listed on this page are ranked in the top twenty within the market and product category by total retail sales volume.

