Mar-2025
Sales
Trend
6-Month
Product Count
SKUs
Overview
Market Insights Snapshot
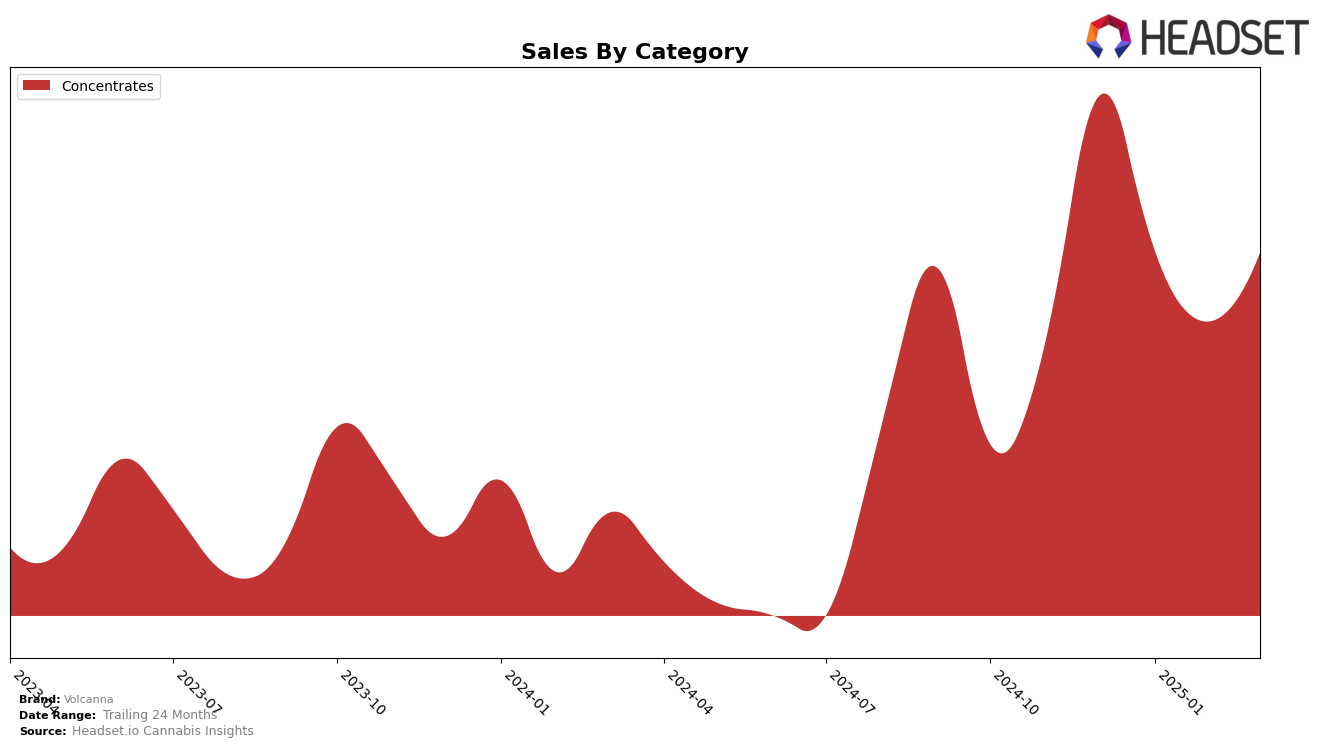
Volcanna's performance in the Massachusetts market has shown some variability across the first quarter of 2025 within the Concentrates category. Starting at rank 12 in December 2024, the brand experienced a dip to rank 20 in January 2025. Despite this setback, Volcanna demonstrated resilience by climbing back to rank 18 in February and improving further to rank 16 in March. This upward trend suggests a positive reception to their products, possibly due to strategic adjustments or market conditions favoring their offerings. However, the initial drop in rank could indicate competitive pressures or a temporary decline in consumer interest during the early months of the year.
Interestingly, Volcanna's sales trajectory in Massachusetts reflects a similar pattern to its ranking shifts. The brand saw a decrease in sales from December 2024 to January 2025, which aligns with their drop in ranking during the same period. However, sales figures rebounded by March 2025, suggesting that Volcanna successfully addressed initial challenges to regain market share. Notably, the brand's absence from the top 30 in other states or provinces points to a concentrated presence in Massachusetts, highlighting both a potential area for growth and a reliance on a single market for a significant portion of their sales. This focus could either be a strategic choice or an indicator of competitive challenges in broader markets.
Competitive Landscape
In the Massachusetts concentrates market, Volcanna has experienced notable fluctuations in its ranking over the first quarter of 2025, which could impact its sales trajectory. Starting from a rank of 12 in December 2024, Volcanna dropped to 20 in January 2025 but showed resilience by climbing back to 16 by March 2025. This recovery is significant given the competitive landscape, where INSA made a remarkable leap from 32 to 15, potentially drawing market share with its substantial sales growth. Meanwhile, Treeworks saw a decline, ending March at rank 20, which might have opened opportunities for Volcanna to regain its standing. Additionally, Fox Tales improved its position to 13, indicating a competitive push that Volcanna must counter to maintain its market presence. These dynamics suggest that while Volcanna faces challenges, strategic adjustments could capitalize on the shifting ranks and bolster its sales performance.

Notable Products
In March 2025, Pebble Runtz Sauce (1g) emerged as the top-performing product for Volcanna, maintaining its consistent number one rank from December 2024 and February 2025, with sales reaching 333 units. Mac V2 Crumble (1g) held onto the second spot, having previously topped the chart in January 2025. Turbinado Sauce (1g) debuted in the rankings at third place, indicating a strong market entry. Unicorn Meat Crumble (1g) also appeared for the first time, securing the fourth position. Garlic Breath Sauce (1g) slipped from its second-place rank in December 2024 to fifth in March 2025, showing a decline in sales momentum.
Top Selling Cannabis Brands
Data for this report comes from real-time sales reporting by participating cannabis retailers via their point-of-sale systems, which are linked up with Headset’s business intelligence software. Headset’s data is very reliable, as it comes digitally direct from our partner retailers. However, the potential does exist for misreporting in the instance of duplicates, incorrectly classified products, inaccurate entry of products into point-of-sale systems, or even simple human error at the point of purchase. Thus, there is a slight margin of error to consider. Brands listed on this page are ranked in the top twenty within the market and product category by total retail sales volume.

