Jun-2026
Sales
Trend
6-Month
Product Count
SKUs
Avg Price
YoY Sales Change
YoY Price Change
Market Insights Snapshot
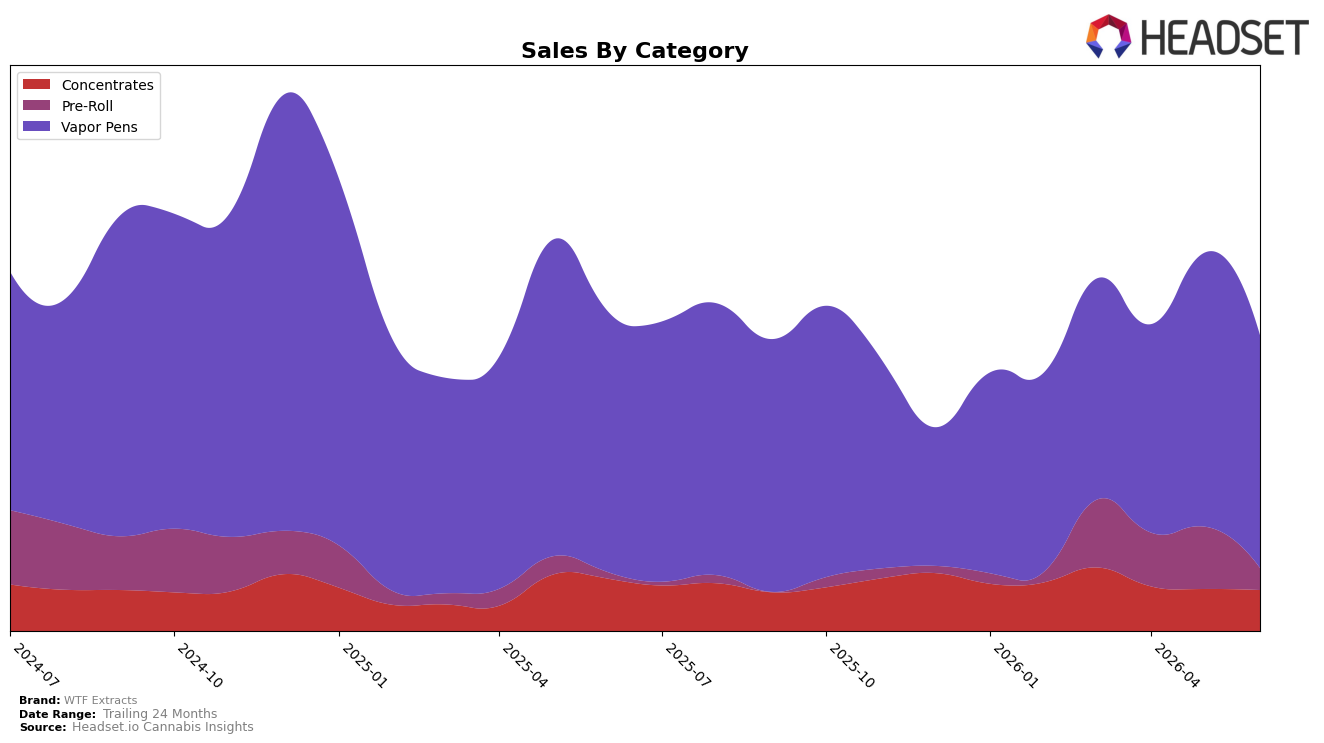
In June 2026, WTF Extracts concentrated 69.15% of sales in Vapor Pens with a year-over-year decline of 9.66% and a month-over-month drop of 13.73%, while Concentrates held 17.96% share with a 14.42% YoY contraction and a milder 1.53% MoM dip; Pre-Roll expanded 47.84% YoY to 12.90% share but fell 45.44% MoM, indicating volatility rather than steady momentum. With overall brand sales down 5.88% YoY and the average price up 14.36%, the mix implies dependency on a weakening core (Vapor Pens) and a Pre-Roll spike that did not sustain month to month, suggesting June 2026 was a rebalancing month where price lift outpaced unit traction.
Given Vapor Pens rank 9 in Arizona within its category and a 69.15% exposure to that segment, the brand’s positioning is anchored to a softening leader while the 47.84% YoY surge in Pre-Roll and the 14.42% YoY slide in Concentrates indicate a barbell profile that adds risk when MoM swings hit 13.73% down in Vapor Pens and 45.44% down in Pre-Roll. The 14.36% YoY increase in average price alongside a 5.88% YoY sales decline points to mix- or price-led strategy that pressures velocity, implying WTF Extracts must either defend rank 9 in Vapor Pens through unit recovery or shift share from the 17.96% Concentrates base into steadier Pre-Roll contributions to avoid amplified month-to-month variance.
Competitive Landscape
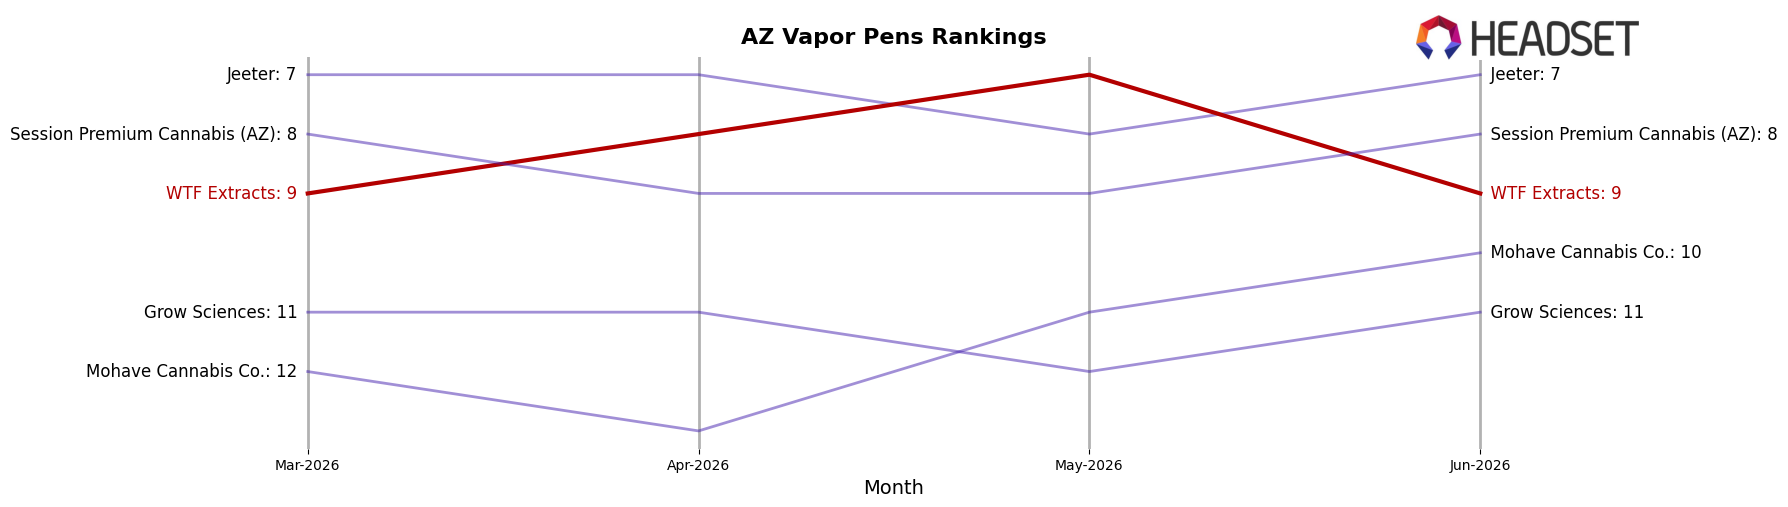
WTF Extracts is ranked #9 in AZ Vapor Pens in June 2026, down 3 positions year over year from #6, and flat versus March 2026 at #9; against this backdrop, Mfused held #1 with a -19.4% year-over-year sales change while Abstrakt climbed from #5 to #2 on 162.2% year-over-year sales growth, indicating that gains are concentrating at the top as middle-tier ranks slip. With WTF Extracts’ peak at #5 in December 2024 and a 4-position decline from that peak to #9, while Dime Industries moved to #3 with a 10.9% sales increase and STIIIZY sits at #5 despite a -14.7% decline, the pattern implies WTF Extracts is ceding share to faster-advancing leaders rather than being displaced by broad market contraction.
Notable Products
Cherry Pie Hoe Distillate Disposable (1g) set the pace in June 2026 with a month-over-month gain of 14.3% while holding rank 3, whereas Blue Raspberry Distillate Disposable (1g) rose 9.2% at rank 5, signaling momentum concentrated in flavored distillate disposables rather than the top two spots. Black Raspberry Haze Cured Badder (1g) led the table at rank 1 with $29,082, but without a stated month-over-month change, its leadership contrasts with faster percentage growth occurring lower in the ranks. With eight of the top ten positioned in Vapor Pens, the mix tilts toward disposable pen volumes over concentrates, implying WTF Extracts is leaning into flavored distillate and live resin pens as the commercial driver.
Top Selling Cannabis Brands
Data for this report comes from real-time sales reporting by participating cannabis retailers via their point-of-sale systems, which are linked up with Headset’s business intelligence software. Headset’s data is very reliable, as it comes digitally direct from our partner retailers. However, the potential does exist for misreporting in the instance of duplicates, incorrectly classified products, inaccurate entry of products into point-of-sale systems, or even simple human error at the point of purchase. Thus, there is a slight margin of error to consider. Brands listed on this page are ranked in the top twenty within the market and product category by total retail sales volume.

