.svg)

Aug-2026
Sales
Trend
6-Month
Product Count
SKUs
Avg Price
YoY Sales Change
YoY Price Change


Market Insights Snapshot
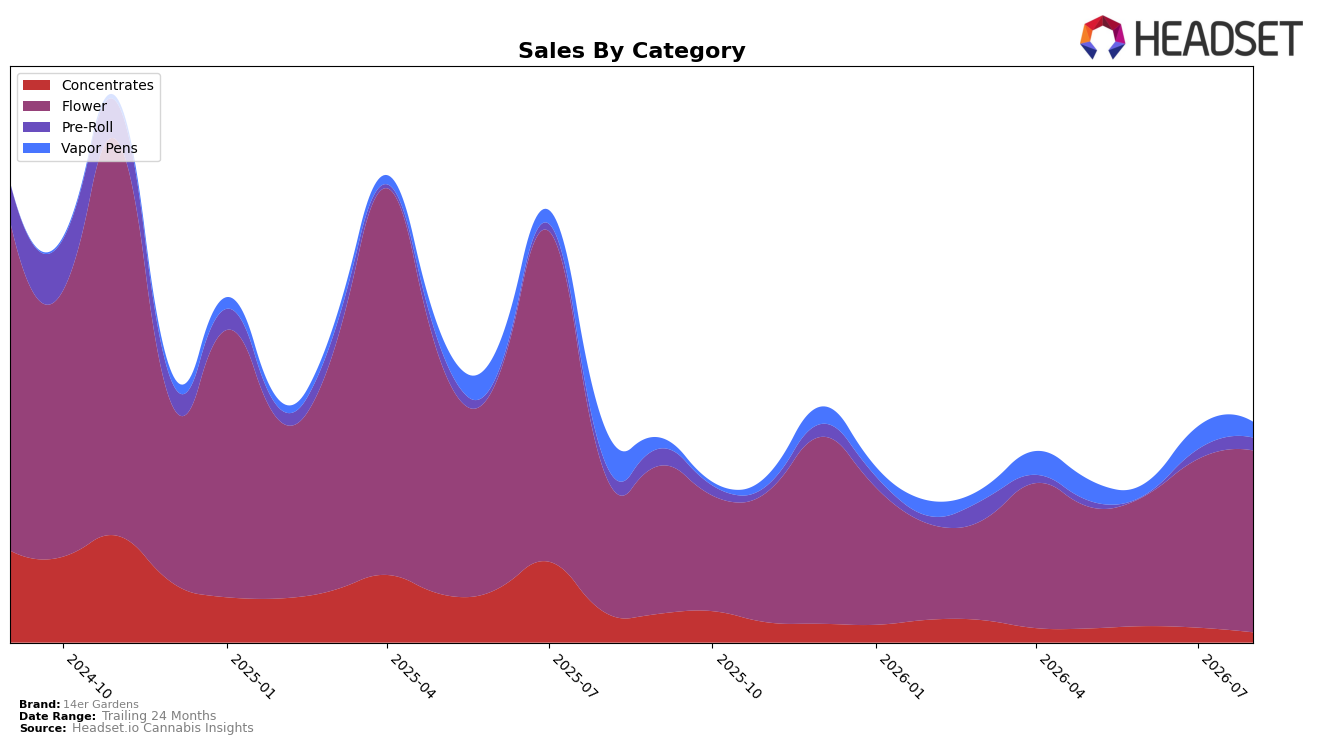
In August 2026, 14er Gardens concentrated 82.08% of sales in Flower, where category sales grew 29.11% year over year and 7.86% month over month, while overall brand sales were up 1.51% YoY and average price declined 10.42% YoY. Vapor Pens contracted to a 7.26% share with a 53.28% YoY drop and a 30.50% MoM decline, versus Pre-Roll at a 5.90% share with 8.42% YoY growth and a 29.33% MoM jump; Concentrates fell to 4.76% share with a 65.91% YoY decline and a 30.66% MoM pullback. With Flower ranked 40 in Colorado and the brand’s 24‑month sales down 51.89%, the mix pattern implies near-term stability is coming from Flower outperformance while underweighted and shrinking segments are dragging aggregate momentum.
The mix shift implies a defensive concentration strategy: reliance on Flower growth (+29.11% YoY, +7.86% MoM) offsets price compression, but steep declines in Vapor Pens (−53.28% YoY) and Concentrates (−65.91% YoY) reduce diversification and limit upside even as Pre-Roll’s 29.33% MoM spike offers a tactical outlet. Given an average price of $19.58 and a Flower rank of 40 in Colorado, the pattern points to a positioning anchored in value-leaning Flower with selective expansion potential in Pre-Roll, while recovery in oil- and extract-based formats would be required to shift the brand out of a single-category dependency.
Competitive Landscape
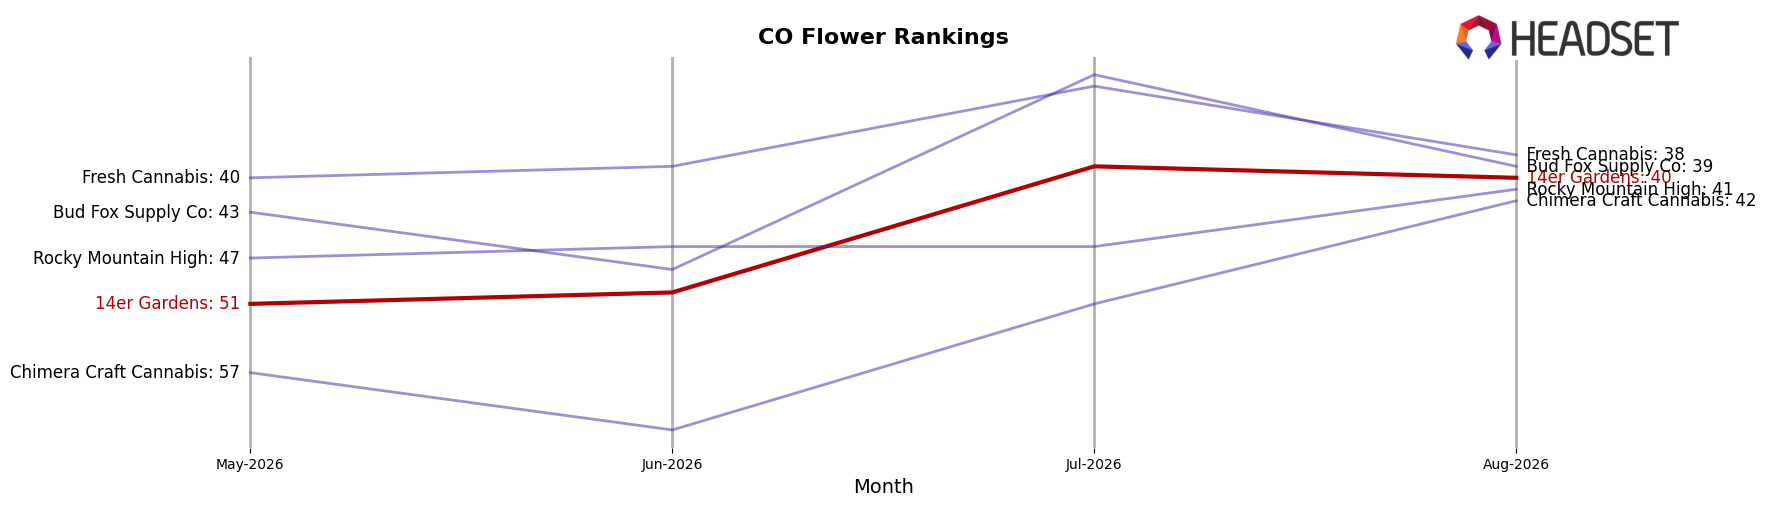
14er Gardens holds rank #40 in August 2026 in CO Flower, improving 15 positions from #55 year over year, and tightening 11 positions from #51 in May 2026 to #40 in August 2026; against this, Seed & Strain Cannabis Co. moved from #2 to #1 with 44.85% YoY sales growth while Green Label Cannabis slipped from #1 to #2 despite 1.27% YoY growth, indicating that 14er Gardens’ upward rank momentum is recovery from a mid-tier trough rather than a return to its April 2025 peak at #14 and will require further share gains to close the competitive gap at the top.
Notable Products
Gary Payton Pre-Roll (1g) delivered the headline move in August 2026 with a 66.9% month-over-month increase and climbed to rank 2, while Jack Herer Pre-Roll (1g) slid 18.6% MoM at rank 6, signaling a sharp divergence within the Pre-Roll set. Lost Tribe (3.5g) held rank 1 with a 49.6% MoM rise and Crepe De La Crepe (3.5g) eased 5.5% at rank 3, and with four of the top ten sitting in Flower the mix is tilting toward high-velocity Flower leadership anchored by one breakout Pre-Roll. The pattern implies 14er Gardens is consolidating around a premium Flower core while selectively scaling a single Pre-Roll winner to diversify traffic and basket-building.
Top Selling Cannabis Brands






Data for this report comes from real-time sales reporting by participating cannabis retailers via their point-of-sale systems, which are linked up with Headset’s business intelligence software. Headset’s data is very reliable, as it comes digitally direct from our partner retailers. However, the potential does exist for misreporting in the instance of duplicates, incorrectly classified products, inaccurate entry of products into point-of-sale systems, or even simple human error at the point of purchase. Thus, there is a slight margin of error to consider. Brands listed on this page are ranked in the top twenty within the market and product category by total retail sales volume.

