.svg)

Sep-2026
Sales
Trend
6-Month
Product Count
SKUs
Avg Price
YoY Sales Change
YoY Price Change


Market Insights Snapshot
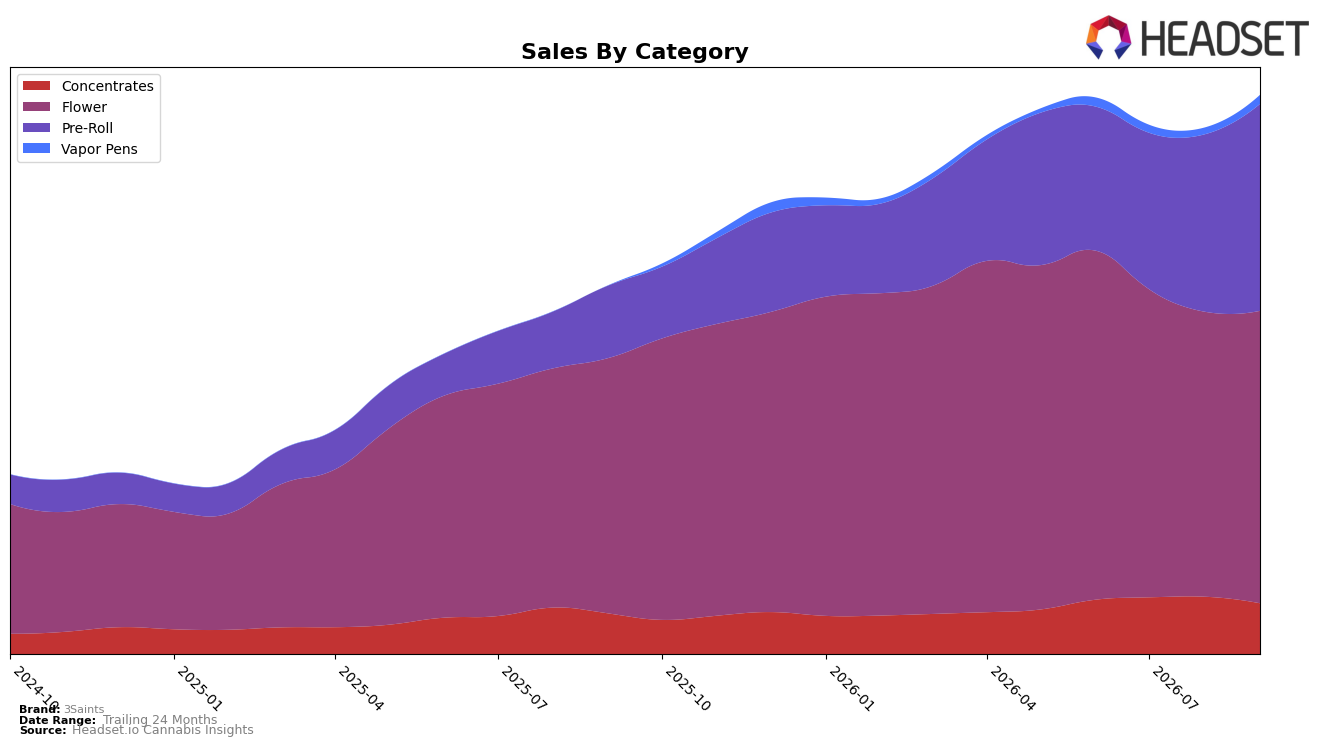
In September 2026, 3Saints centered 52.34% of sales in Flower with a 14.56% year-over-year gain and a 2.61% month-over-month lift, while Pre-Roll expanded to a 37.02% share on 186.14% YoY growth and 16.67% MoM growth; together these two categories account for 89.36% of mix. Concentrates held 9.07% share with 24.95% YoY growth but contracted 11.46% MoM, and Vapor Pens, though only 1.57% share, jumped 34.66% MoM with no reported YoY comp; average brand price in September 2026 was up 0.70% YoY to $21.44 and Flower pricing sat higher at $35.25. The pattern implies 3Saints is reallocating momentum toward Pre-Roll to drive incremental volumes without eroding its Flower anchor, using targeted MoM gains in Vapor Pens to test adjacency while tolerating short-term Concentrates pullback.
With a 9th place Flower ranking in Alberta and a 52.34% Flower mix, 3Saints maintains credibility in the core while the 186.14% YoY surge in Pre-Roll and 16.67% MoM acceleration suggest mix-led share capture rather than price-based moves given just a 0.70% YoY price increase. The 11.46% MoM decline in Concentrates alongside a 34.66% MoM lift in Vapor Pens signals a portfolio tilt toward inhalable convenience formats that can scale, indicating that September 2026 positioning emphasizes broader basket reach via Pre-Roll/Vapor Pens while keeping Flower as the rank-stabilizing base.
Competitive Landscape
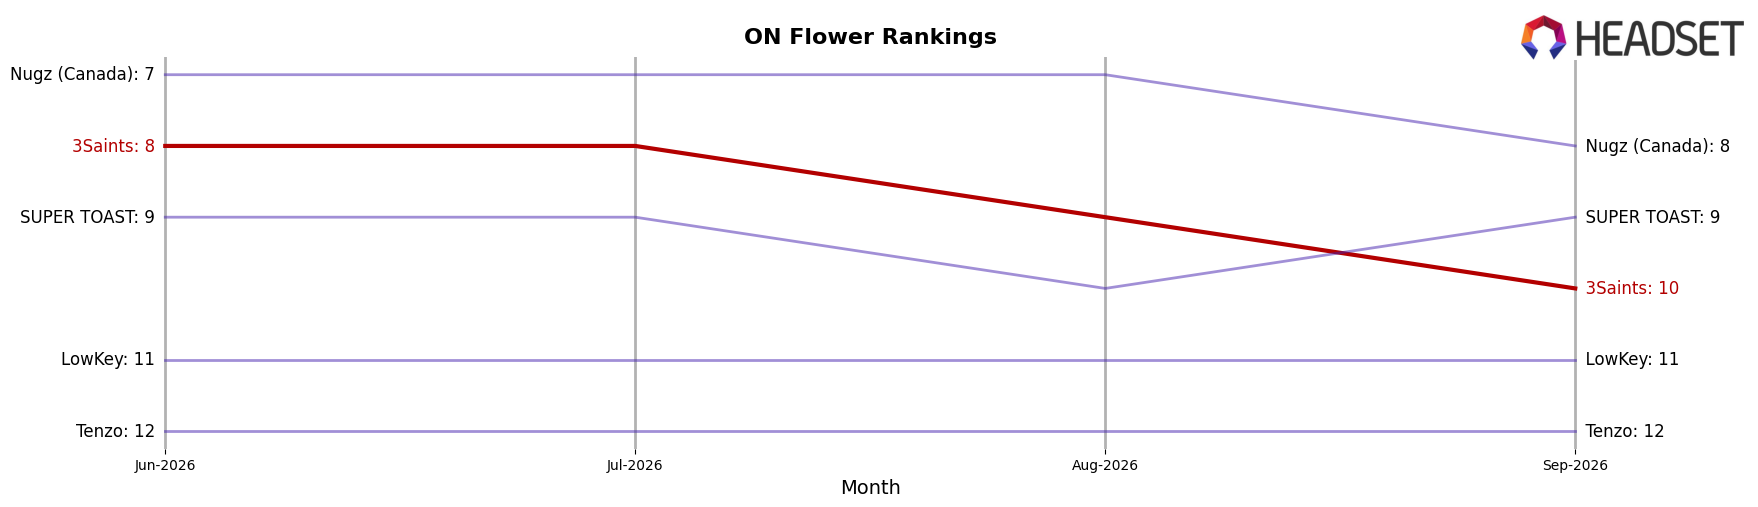
3Saints sits at rank #10 in ON Flower for September 2026, improving 2 positions year over year from #12 while slipping 2 spots from #8 in June 2026, and it remains 3 positions below its peak #7 from May 2026; against this, Spinach climbed from #3 to #1 with a 15.7% YoY sales lift and Back Forty / Back 40 Cannabis fell from #1 to #3 alongside a 7.4% YoY sales decline, indicating that 3Saints’ upward YoY shift paired with recent quarter slippage places it in a narrowing mid-tier where sustained gains will require recapturing momentum lost since May 2026.
Notable Products
Black Afghan Hash (2g) posted the steepest movement in September 2026 with a -11.0% month-over-month decline while holding rank 4, signaling pressure on concentrates as Pre-Rolls advanced with rank 1 and rank 3 gains of 12.9% and 10.7% respectively. Kush Cookies Pre-Roll (0.5g) at rank 1 rose 12.9% while Strawberry Cheezequake Pre-Roll 4-Pack (2g) at rank 3 climbed 10.7%, and with six of the top ten in Pre-Roll, mix is consolidating toward inhalables where small format momentum can offset softness in concentrates.
Top Selling Cannabis Brands






Data for this report comes from real-time sales reporting by participating cannabis retailers via their point-of-sale systems, which are linked up with Headset’s business intelligence software. Headset’s data is very reliable, as it comes digitally direct from our partner retailers. However, the potential does exist for misreporting in the instance of duplicates, incorrectly classified products, inaccurate entry of products into point-of-sale systems, or even simple human error at the point of purchase. Thus, there is a slight margin of error to consider. Brands listed on this page are ranked in the top twenty within the market and product category by total retail sales volume.

