Jun-2026
Sales
Trend
6-Month
Product Count
SKUs
Avg Price
YoY Sales Change
YoY Price Change
Market Insights Snapshot

In June 2026, 7 Acres concentrated nearly half of sales in Pre-Roll at 47.41% share with year-over-year down 39.79% and month-over-month down 5.33%, while Flower contracted to 25.28% share with year-over-year down 56.16% and month-over-month down 35.32%. Counterbalancing, Vapor Pens reached 20.67% share with year-over-year up 4.89% and month-over-month up 0.82%, and Concentrates held 6.65% share with year-over-year up 9.70% but month-over-month down 11.82%. The weighted mix implies that 7 Acres is shifting demand away from higher-priced Flower, where the average price is $62.49, toward lower-ticket Pre-Roll at $10.56 and steadier Vapor Pens at $39.64, concentrating risk in a segment that is also sliding rank-wise in British Columbia where Pre-Roll sits at rank 51.
The mix shift suggests a repositioning toward accessible inhalables, as Vapor Pens’ 4.89% year-over-year growth and 20.67% share expand while Flower’s 56.16% year-over-year contraction and 35.32% month-over-month drop compress its role; this tilts the brand toward convenience formats that can stabilize volume but pressure revenue per unit. With Pre-Roll still the largest share at 47.41% yet declining 5.33% month-over-month and holding rank 51 in British Columbia, the brand’s influence is increasingly tied to an underperforming anchor, implying that future positioning will rely on leveraging Vapor Pens’ incremental gains to offset Pre-Roll and Flower drag while avoiding overexposure to Concentrates’ 11.82% month-over-month volatility despite its 9.70% year-over-year lift.
Competitive Landscape
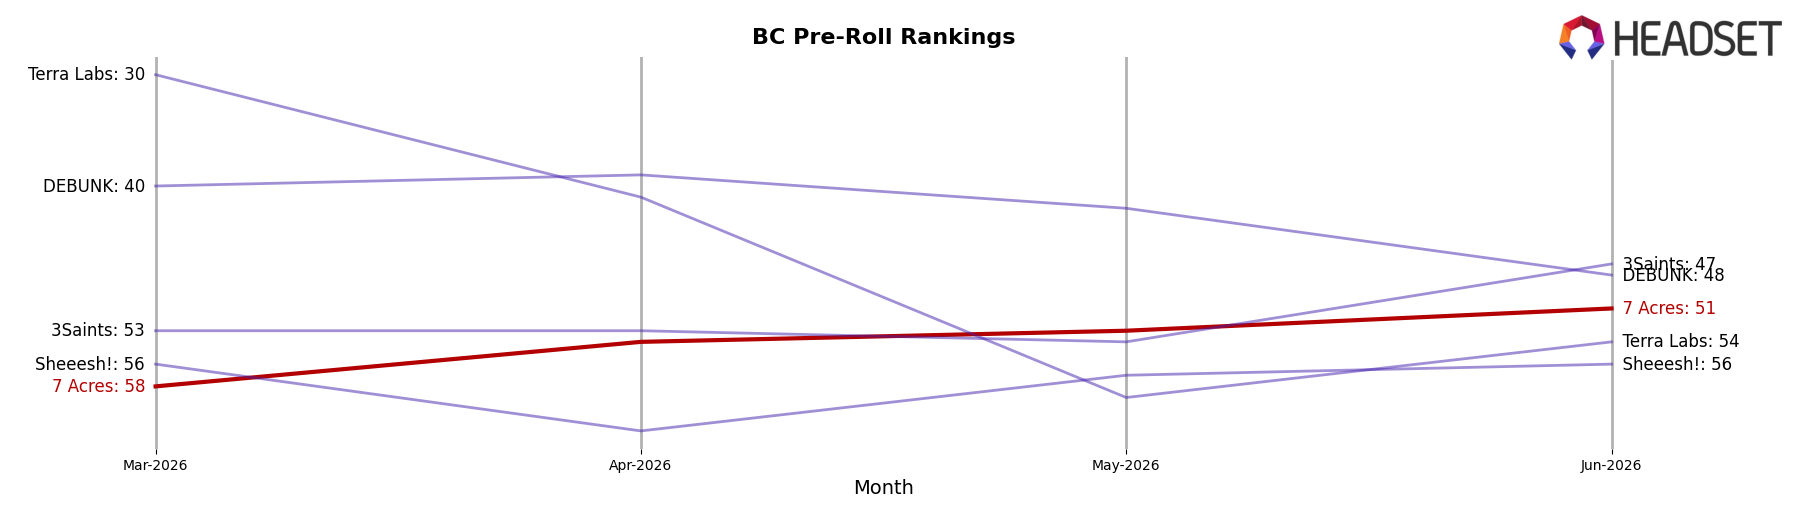
7 Acres sits at rank #51 in BC Pre-Roll for June 2026, down 3 positions year over year from #48 and up 7 positions versus March 2026’s #58, while still far from its peak at #19 in July 2024; in contrast, General Admission held #1 year over year with a -18.9% YoY sales change, and Back Forty / Back 40 Cannabis climbed from #22 to #3 on 263.3% YoY growth, indicating that 7 Acres’ mild quarter-over-quarter improvement has not matched the upward mobility of faster-rising peers and points to share erosion unless mix or pricing strategy shifts.
Notable Products
Sour Tangerine Live Resin Diamonds Disposable (0.95g) posted the steepest decline at -19.997% month over month while falling to rank 5, and Silver Diesel (7g) dropped -28.774% at rank 6, signaling pressure on both value flower and flavored vapes. In contrast, Ultra Jack Pre-Roll 2-Pack (1g) jumped +47.641% to rank 4 and Jack Haze Live Resin Liquid Diamonds Disposable (0.95g) rose +46.200% to rank 3, even as Jack Haze Pre-Roll 2-Pack (1g) held rank 1 with a -3.695% dip and approximately $223,749 in June 2026 sales. Three of the top five are Vapor Pens and two of the top four are Pre-Rolls, indicating a portfolio tilt toward inhalables over flower, with White Widow (28g) also sliding -27.130% at rank 9. The pattern implies 7 Acres is consolidating around Jack-branded pre-rolls and liquid-diamond vapes while de-emphasizing large-format flower that is losing rank and share.
Top Selling Cannabis Brands
Data for this report comes from real-time sales reporting by participating cannabis retailers via their point-of-sale systems, which are linked up with Headset’s business intelligence software. Headset’s data is very reliable, as it comes digitally direct from our partner retailers. However, the potential does exist for misreporting in the instance of duplicates, incorrectly classified products, inaccurate entry of products into point-of-sale systems, or even simple human error at the point of purchase. Thus, there is a slight margin of error to consider. Brands listed on this page are ranked in the top twenty within the market and product category by total retail sales volume.

