Dec-2024
Sales
Trend
6-Month
Product Count
SKUs
Overview
Market Insights Snapshot
In the Ohio market, Appalachian Pharm's performance in the Edible category has shown some fluctuations over the last few months. The brand maintained a steady position at rank 24 in October and November 2024, before dropping to rank 29 in December. This decline suggests potential challenges in maintaining consumer interest or competition from other brands. Notably, the sales figures in October reached $97,013, indicating a peak in performance for this period, before declining in the following months. Such trends highlight the volatile nature of the Edible category for Appalachian Pharm in Ohio, suggesting room for strategic adjustments to regain a stronger foothold.
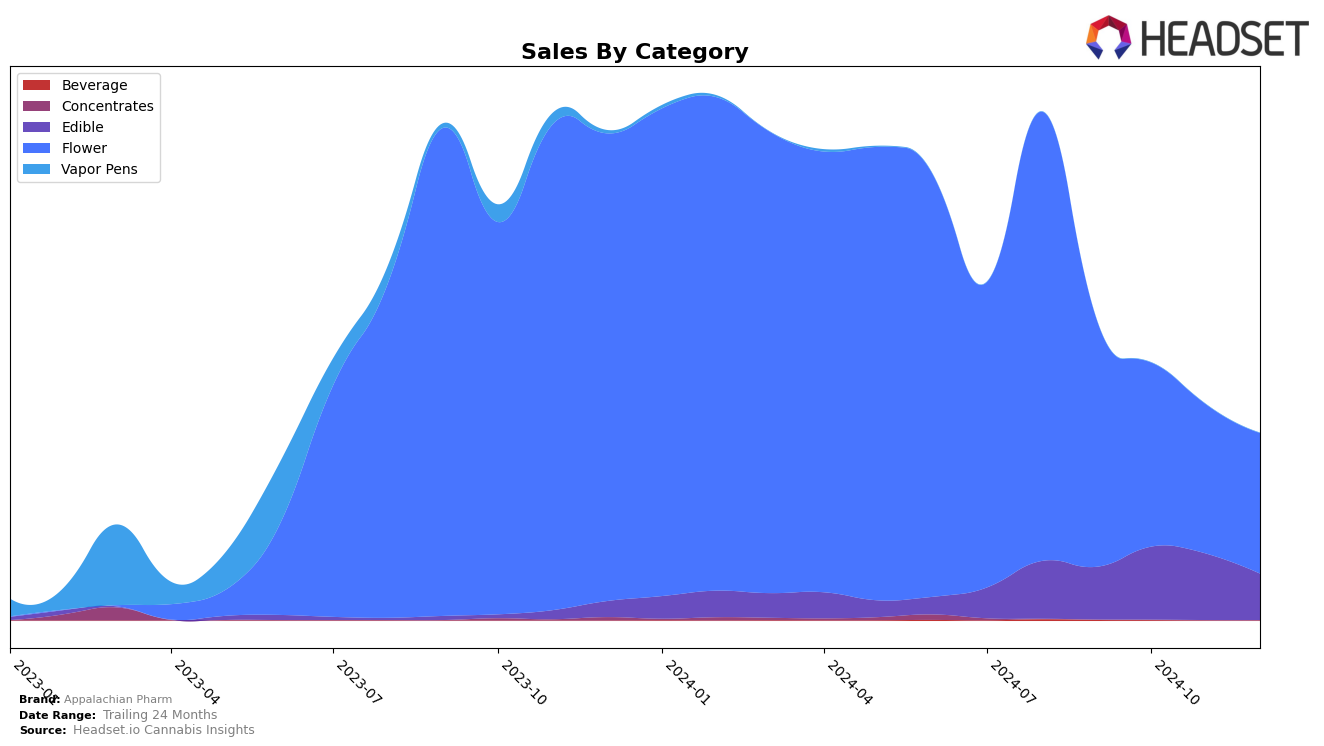
In the Flower category within Ohio, Appalachian Pharm experienced a slight decline in its ranking, moving from the 29th position in September to falling out of the top 30 by November and December 2024. This shift out of the top 30 could be concerning, as it indicates a loss of competitive edge or market share in a highly competitive space. Despite this, the brand's sales have shown a downward trend from $327,014 in September to $187,441 in December, marking a significant decrease. This downward trajectory in both ranking and sales suggests that Appalachian Pharm may need to reassess its strategies in the Flower category to combat declining performance and regain its standing in the market.
Competitive Landscape
In the competitive landscape of the Ohio flower market, Appalachian Pharm has maintained a relatively stable position, ranking 31st in both November and December 2024. Despite a slight decline from its 29th rank in September, Appalachian Pharm's sales trajectory mirrors a broader market trend of decreasing sales across the board. Notably, Moxie experienced a significant drop in rank from 16th in September to 30th in December, indicating a sharper decline in sales compared to Appalachian Pharm. Meanwhile, Ascension showed some volatility, improving to 29th in December from 35th in October, suggesting potential competitive pressure. Firelands Scientific and Verano also displayed fluctuating ranks, with Firelands Scientific ending December at 33rd and Verano at 34th. These shifts highlight the dynamic nature of the market, where Appalachian Pharm's consistent ranking suggests a steady customer base amidst the competitive pressures.

Notable Products
In December 2024, the top-performing product for Appalachian Pharm was Runtz Berries (2.83g) in the Flower category, which climbed to the number one rank with notable sales of 2,266 units. Alien Mints (2.83g), also in the Flower category, maintained a strong position at rank two, showing consistent performance from previous months. The CBD/CBN/CBG.THC 1:1:1:1 Nano Entourage Key Lime Gummies 11-Pack, an Edible, secured the third position, experiencing a slight drop from November's second rank. The THC/CBN 1:3 Blueberry Lemonade + CBN Gummies 11-Pack, another Edible, fell to fourth place after being the top product in November. Sherb Envy (2.83g), a new entrant in the rankings, debuted at fifth place, indicating potential growth in the Flower category.
Top Selling Cannabis Brands
Data for this report comes from real-time sales reporting by participating cannabis retailers via their point-of-sale systems, which are linked up with Headset’s business intelligence software. Headset’s data is very reliable, as it comes digitally direct from our partner retailers. However, the potential does exist for misreporting in the instance of duplicates, incorrectly classified products, inaccurate entry of products into point-of-sale systems, or even simple human error at the point of purchase. Thus, there is a slight margin of error to consider. Brands listed on this page are ranked in the top twenty within the market and product category by total retail sales volume.

