Mar-2025
Sales
Trend
6-Month
Product Count
SKUs
Overview
Market Insights Snapshot
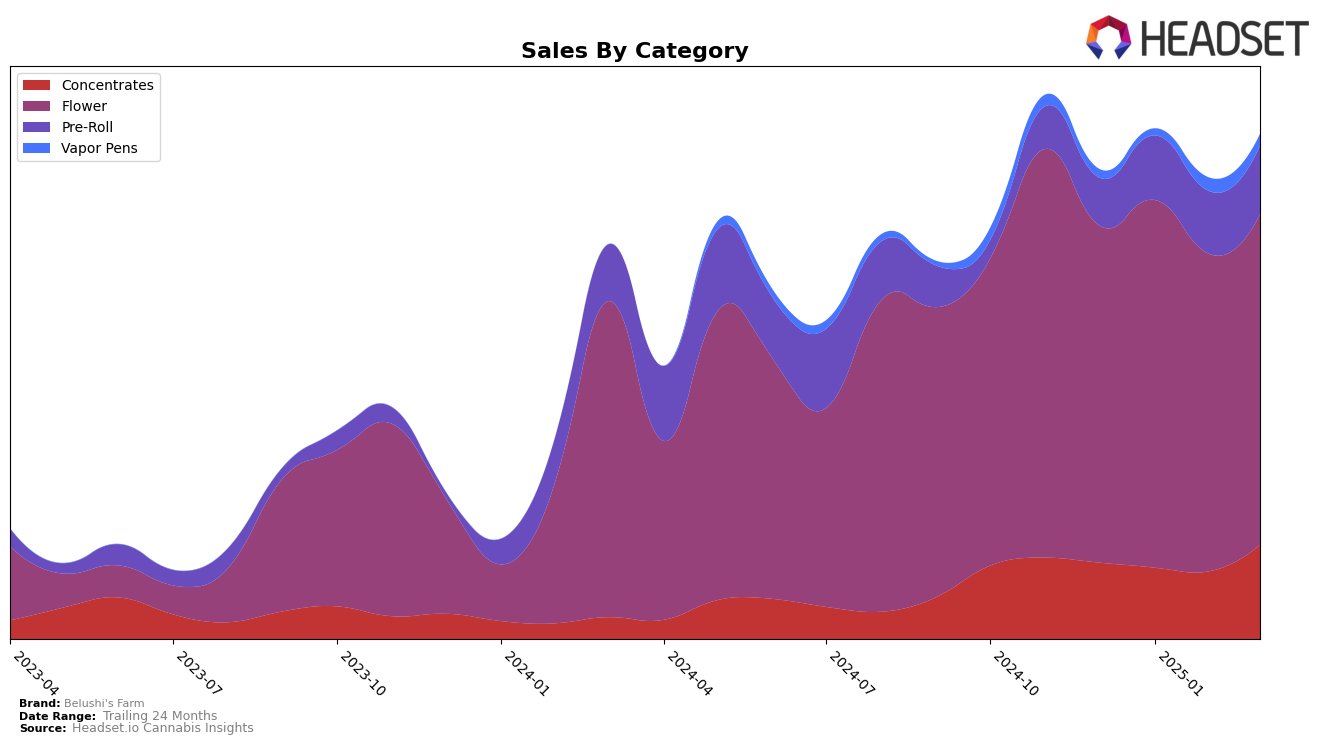
Belushi's Farm has demonstrated varied performance across different states and product categories in recent months. In Massachusetts, the brand's presence in the concentrates category has seen a decline, with rankings dropping out of the top 30 by March 2025. This suggests a potential challenge in maintaining market share or a shift in consumer preferences. Meanwhile, in Michigan, there is a positive trajectory in the concentrates category, where the brand improved its ranking from 52nd in December 2024 to 36th by March 2025, indicating an upward trend in sales performance and possibly growing consumer interest.
In the flower category, Maryland shows a slight decline in rankings for Belushi's Farm, moving from 30th in December 2024 to 34th by March 2025. However, in Missouri, the brand has made significant strides, entering the rankings at 52nd in January 2025 and climbing to 40th by March, reflecting a successful penetration into this market. On the other hand, Oregon presents a mixed picture, where the brand's flower category ranking dropped from 52nd to out of the top 30 by March 2025, potentially indicating increased competition or changing market dynamics. These movements highlight the varying challenges and opportunities faced by Belushi's Farm across different regions and product lines.
Competitive Landscape
In the competitive landscape of the Flower category in Missouri, Belushi's Farm has shown a promising upward trajectory in recent months. Starting from outside the top 20 in December 2024, the brand climbed to rank 52 in January 2025 and continued its ascent to reach rank 40 by March 2025. This positive trend is indicative of a significant increase in sales, suggesting that Belushi's Farm is gaining traction in the market. In contrast, Willie's Reserve experienced a decline from rank 36 in January to 45 in March, while Curio Wellness entered the top 50 in February and improved to rank 37 by March. Meanwhile, Packs Cannabis (MO) saw fluctuations, dropping from rank 19 in January to 40 in February, before recovering to 35 in March. Farmer G maintained a relatively stable position, hovering around the high 30s and low 40s. These dynamics highlight Belushi's Farm's potential to further improve its market position amidst fluctuating performances from its competitors.

Notable Products
In March 2025, Mule Fuel (3.5g) emerged as the top-performing product for Belushi's Farm, climbing from its consistent third position in January and February to first place, with sales reaching 4183 units. Hashburger (3.5g) also saw a significant rise, moving from fourth in February to second in March. Cadillac Rainbows (3.5g) dropped one spot to third after being second in February, while La Kush Cake (1g) maintained its fourth position from the previous month. Notably, Hashburger Pre-Roll 2-Pack (1g) entered the rankings for the first time in March at fifth place. Overall, March saw some dynamic shifts in product rankings, highlighting changing consumer preferences.
Top Selling Cannabis Brands
Data for this report comes from real-time sales reporting by participating cannabis retailers via their point-of-sale systems, which are linked up with Headset’s business intelligence software. Headset’s data is very reliable, as it comes digitally direct from our partner retailers. However, the potential does exist for misreporting in the instance of duplicates, incorrectly classified products, inaccurate entry of products into point-of-sale systems, or even simple human error at the point of purchase. Thus, there is a slight margin of error to consider. Brands listed on this page are ranked in the top twenty within the market and product category by total retail sales volume.

