Mar-2025
Sales
Trend
6-Month
Product Count
SKUs
Overview
Market Insights Snapshot
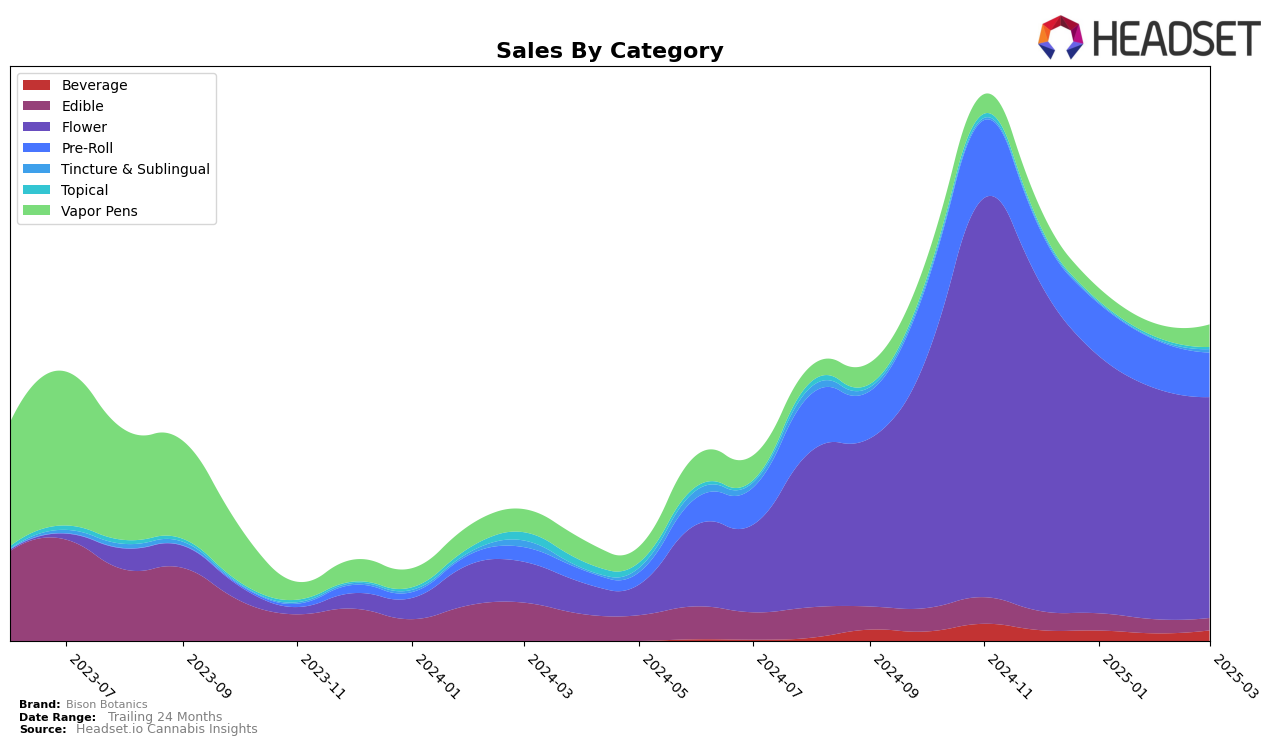
Bison Botanics has shown varied performance across different product categories in New York. In the Edibles category, the brand has struggled to gain a foothold in the top 30, with rankings hovering in the low 50s to mid-50s from December 2024 to February 2025, and notably, they did not make it to the top 30 in March 2025. This could be indicative of growing competition or a shift in consumer preferences. In contrast, their performance in the Flower category has shown a gradual decline in rank from 28th to 45th over the same period, suggesting a need to reassess strategies in this highly competitive market. However, it is worth noting that their sales volume in this category remains significant despite the drop in rank.
In the Pre-Roll category, Bison Botanics has consistently ranked outside the top 30 in New York, with a downward trend from 73rd in December 2024 to 85th in March 2025. This decline may highlight challenges in capturing consumer interest or possibly a shift in market dynamics. Interestingly, their Vapor Pens category saw a jump back into the rankings in March 2025 at 74th, after not being in the top 30 for the preceding two months. This resurgence could point to effective marketing strategies or product improvements that have resonated with consumers. Overall, while Bison Botanics faces challenges in maintaining top-tier rankings, certain categories show promise with strategic adjustments.
Competitive Landscape
In the competitive landscape of the flower category in New York, Bison Botanics experienced a notable shift in its market position from December 2024 to March 2025. Initially ranked 28th in December 2024, Bison Botanics saw a decline in rank to 45th by March 2025, indicating a challenging period in maintaining its competitive edge. During this time, brands like Old Pal and CAM showed fluctuating yet competitive performances, with Old Pal reaching as high as 31st in February 2025 before dropping to 44th in March. Meanwhile, House of Sacci maintained a relatively stable presence, albeit with a slight decline in rank. Despite these challenges, Bison Botanics' sales figures remained robust, though they experienced a gradual decrease over the months, suggesting a need for strategic adjustments to regain its earlier market position. The competitive dynamics highlight the importance of agility and innovation in sustaining growth within New York's flower market.

Notable Products
In March 2025, the top-performing product for Bison Botanics was Gorilla Cookies x Birthday Cake x Thin Mint Cookies (3.5g) from the Flower category, which rose to the number one spot after being second in February, with sales reaching 3,635 units. Loganberry Sparkling Beverage (10mg THC, 355ml, 12oz) secured the second position, maintaining its consistent fourth-place ranking from the previous three months, and recorded sales of 1,050 units. Cookies & Cream (3.5g) experienced a slight improvement, moving up from fifth in February to third in March. Nana Glue (3.5g) dropped to fourth place from its third position the previous month, indicating a decline in popularity. Lastly, Loganberry Sparkling Beverage (5mg THC, 355ml, 12oz) re-entered the rankings at fifth place, showing renewed interest in this lower-dose option.
Top Selling Cannabis Brands
Data for this report comes from real-time sales reporting by participating cannabis retailers via their point-of-sale systems, which are linked up with Headset’s business intelligence software. Headset’s data is very reliable, as it comes digitally direct from our partner retailers. However, the potential does exist for misreporting in the instance of duplicates, incorrectly classified products, inaccurate entry of products into point-of-sale systems, or even simple human error at the point of purchase. Thus, there is a slight margin of error to consider. Brands listed on this page are ranked in the top twenty within the market and product category by total retail sales volume.

