Jun-2026
Sales
Trend
6-Month
Product Count
SKUs
Avg Price
YoY Sales Change
YoY Price Change
Market Insights Snapshot
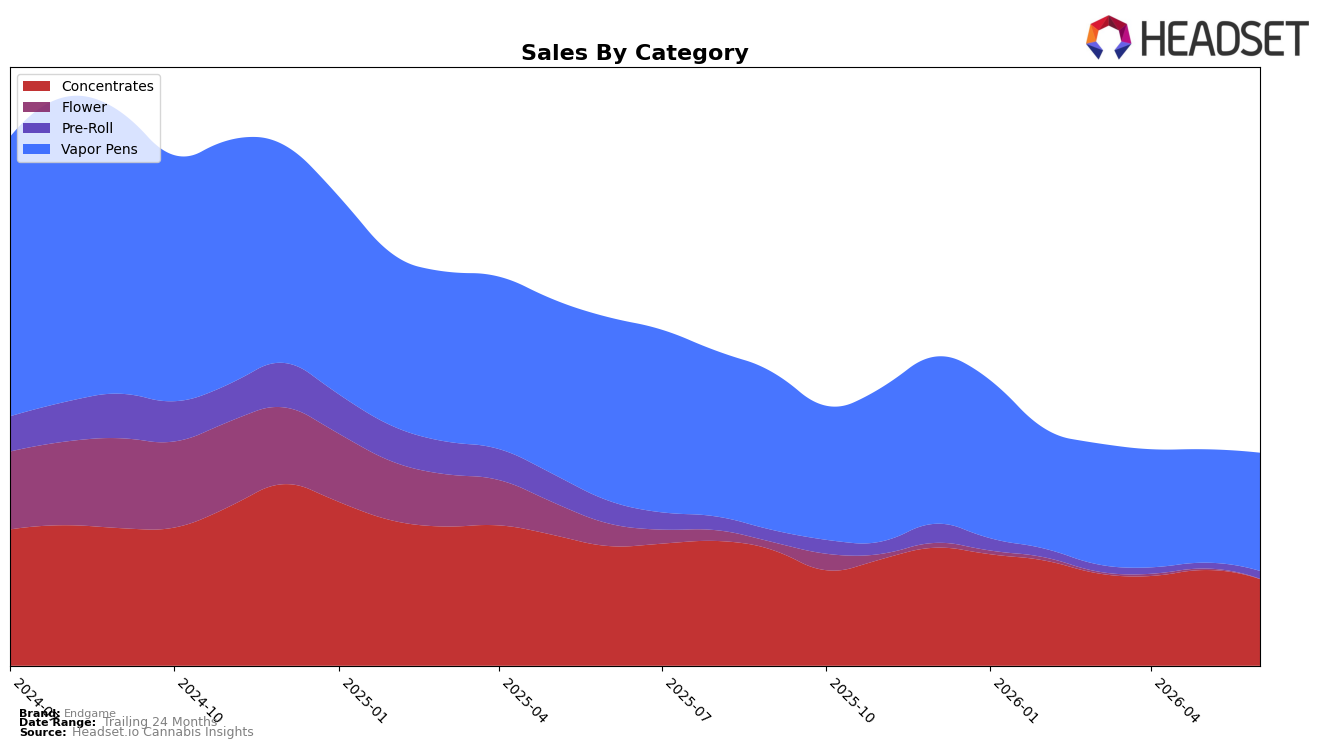
Endgame concentrated 55.27% of June 2026 sales in Vapor Pens with a 4.18% month-over-month lift but a 35.49% year-over-year decline, while Concentrates held 40.57% share with a 9.45% month-over-month drop and a 27.57% year-over-year decline. Pre-Roll remained a small 3.86% share yet jumped 33.04% month over month despite a 64.32% year-over-year fall, and Flower shrank to 0.31% share with a 63.90% month-over-month contraction and a 97.10% year-over-year decline. The mix indicates an anchored reliance on Vapor Pens and Concentrates despite double-digit year-over-year declines, with a tactical rebound in Pre-Roll suggesting near-term basket-entry experimentation that could mitigate the broader brand sales decline of 38.72% year over year.
The 4.18% month-over-month gain in Vapor Pens alongside a 9.45% month-over-month drop in Concentrates implies Endgame’s positioning is tilting toward inhalable convenience where Vapor Pens can absorb price-led trade-down, consistent with a 10.33% year-over-year decrease in average price. The 33.04% month-over-month rise in Pre-Roll against a 0.31% share for Flower signals a portfolio gravitating to format-forward, low-prep occasions, while a Vapor Pens category rank of 14 in Saskatchewan frames Endgame as mid-pack with room to climb through targeted assortment. Net, the shift implies prioritizing Vapor Pens as the lead with selective Pre-Roll expansion to capture incremental trips, while de-emphasizing Flower where the 97.10% year-over-year decline and 63.90% month-over-month drop indicate limited strategic return.
Competitive Landscape
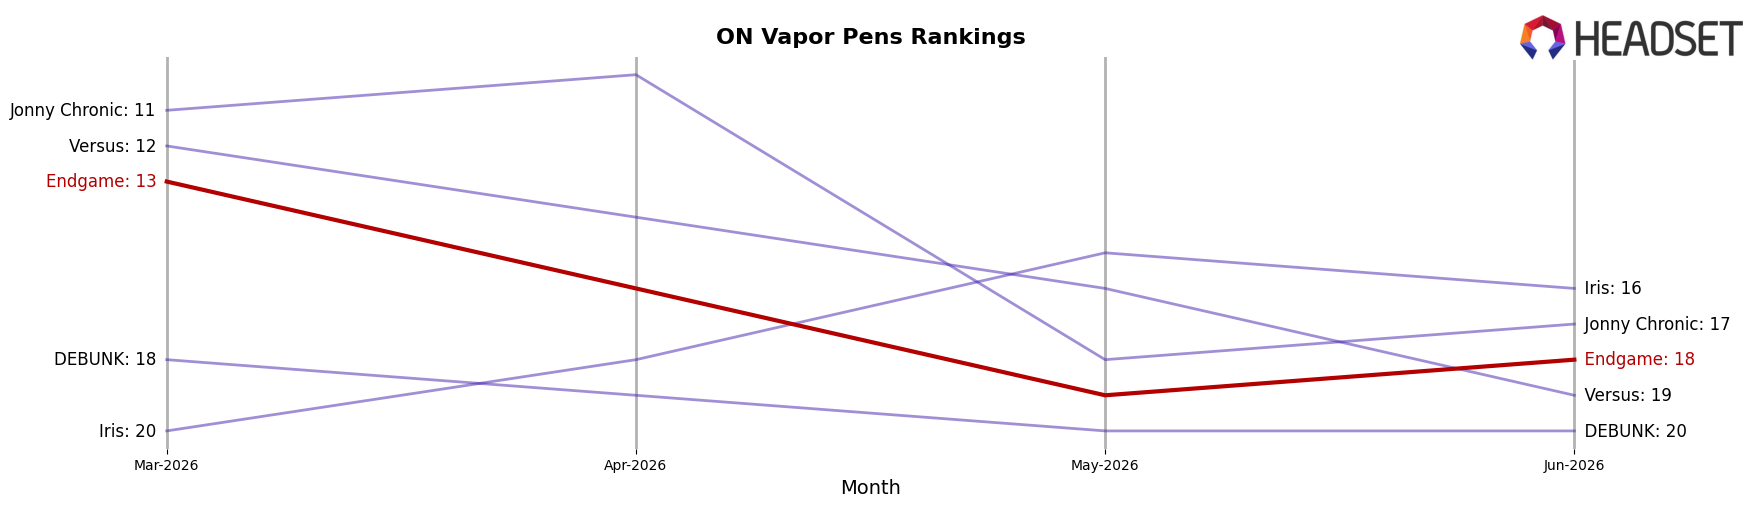
Endgame sits at rank #18 in June 2026, sliding 7 spots year over year from #11, and down 5 positions since March 2026 when it held #13; against a historical peak of #6 in August 2024, the current #18 marks a 12-place drop from peak. Competitors tightened the top tier: Spinach climbed from #5 to #1 alongside 173.8% YoY sales growth, while BoxHot eased from #1 to #3 with a 22.1% YoY decline, and General Admission moved from #3 to #4 amid a 24.6% YoY contraction; in contrast, Endgame’s 3-month slide of 5 ranks paired with a 7-rank YoY drop signals that share is consolidating above it rather than fragmenting. The pattern implies Endgame’s trajectory is one of displacement by accelerating leaders and slower decliners, requiring movement back into the top-15 to avoid further entrenchment below #18.
Notable Products
Astro Pink THCA Isolate (1g) posted the steepest contraction in June 2026 at -25.9% MoM, slipping to rank 8, while Hard Hitters - Psycho Citrus Liquid Diamond Cartridge (1g) fell -15.1% to rank 4; in contrast, Mimosa x Blood Orange Distillate Cartridge (1g) rose +27.7% to rank 1 and Hard Hitters - Blueberry Octane Liquid Diamond Cartridge (1g) climbed +26.9% to rank 2. Vapor Pens account for four of the top ten, with two advancing into the top two ranks and only one posting a double-digit decline, whereas Concentrates hold five of the top ten but include three double-digit MoM drops led by Designer Pink Shatter (1g) at -21.4% and Platinum Jelly Shatter (1g) at -15.4%. The mix—pen-led rank gains paired with concentrated declines in several Concentrates SKUs—implies Endgame is tilting assortment and demand toward Vapor Pens over extracts for near-term growth.
Top Selling Cannabis Brands
Data for this report comes from real-time sales reporting by participating cannabis retailers via their point-of-sale systems, which are linked up with Headset’s business intelligence software. Headset’s data is very reliable, as it comes digitally direct from our partner retailers. However, the potential does exist for misreporting in the instance of duplicates, incorrectly classified products, inaccurate entry of products into point-of-sale systems, or even simple human error at the point of purchase. Thus, there is a slight margin of error to consider. Brands listed on this page are ranked in the top twenty within the market and product category by total retail sales volume.

