Market Insights Snapshot
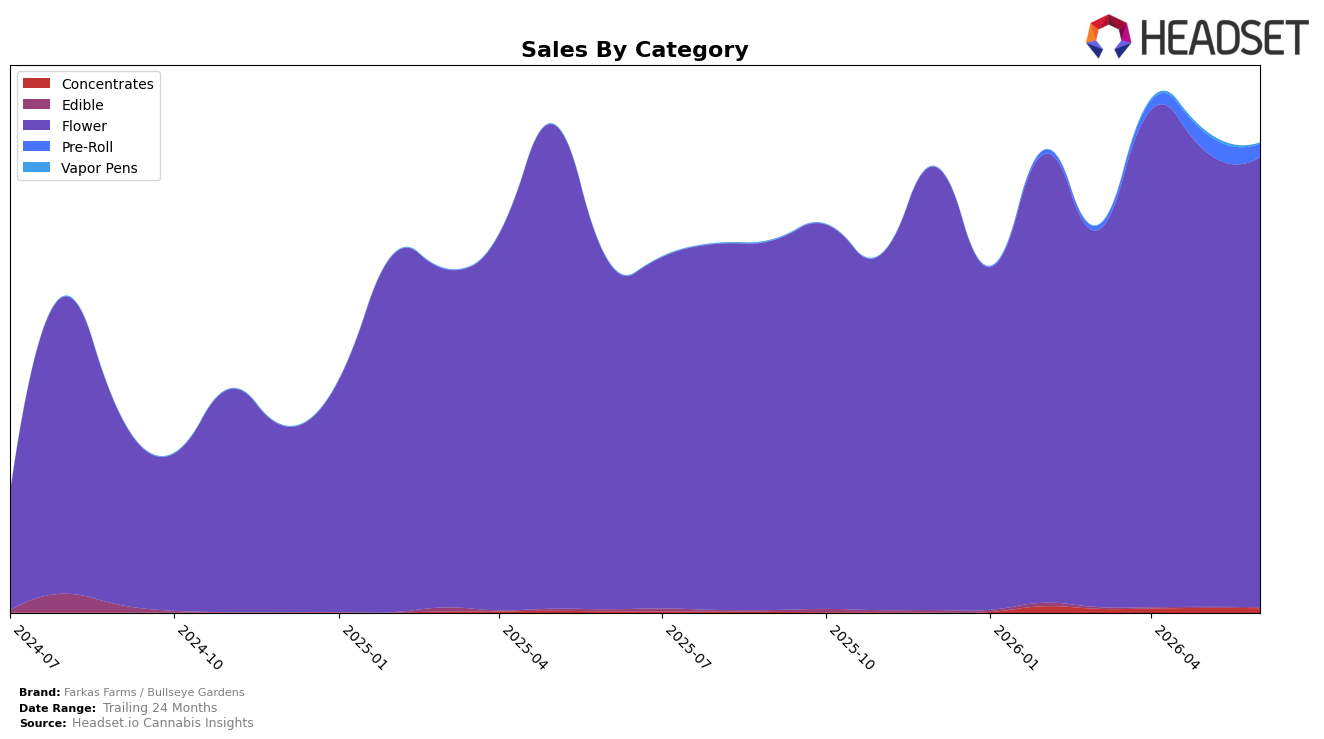
Farkas Farms / Bullseye Gardens concentrated 96.02% of June 2026 sales in Flower, up 29.40% year over year while edging down 1.36% month over month, with Pre-Roll at 2.74% share falling 27.01% MoM and lacking a reported YoY rate. Smaller lines were mixed: Concentrates held 0.93% share with 261.49% YoY growth but slipped 7.55% MoM, Vapor Pens at 0.20% surged 5,715.35% YoY yet dropped 55.39% MoM, and Edible at 0.11% declined 68.77% YoY and 6.30% MoM. The brand’s average price rose 16.28% YoY to $46.91 while overall brand sales advanced 33.67% YoY, and Flower ranked 5th in Ohio; taken together, the mix implies a Flower-led profile that is adding premium while experiencing short-term softness in secondary formats.
The near-total reliance on Flower alongside a 33.67% YoY lift in total sales and a 16.28% YoY price increase suggests pricing power anchored in a top-5 Flower position in Ohio, while the 1.36% MoM dip in Flower and 27.01% MoM pullback in Pre-Roll indicate sensitivity to monthly demand swings. outsized but tiny-base YoY spikes in Vapor Pens (5,715.35%) and Concentrates (261.49%) contrast with their sub-1% to 0.20% shares and negative MoM trends, implying trial rather than scale; the pattern points to a need for either deeper Flower differentiation to defend rank 5 or selective expansion where MoM stability can convert high YoY momentum into material share.
Competitive Landscape
Farkas Farms / Bullseye Gardens sits at rank #5 in Ohio Flower in June 2026, up 2 positions year over year from #7 and 3 positions since March 2026 from #8, while still 2 spots below its peak of #3 set in December 2025; in contrast, Klutch Cannabis surged from #20 to #1 with 304.8% year-over-year sales growth and Buckeye Relief slipped from #2 to #4 alongside a 19.5% sales decline, and Riviera Creek eased from #1 to #2 with a 22.7% drop, indicating that Farkas Farms / Bullseye Gardens’ steady climb amid both upward and downward competitor moves points to share being won through relative stability rather than breakout acceleration.

Notable Products
Orange Octane (3.5g) had the steepest decline in June 2026 at -50.2% and slid to rank 10, while Fire Cookies (3.5g) fell -25.8% to rank 3; in contrast, GMO Zkittlez Pre-Roll (0.75g) rose +46.0% to claim rank 1. Seven of the top ten are Flower SKUs, yet the only Pre-Roll leads the chart, implying a shift in basket entry toward ready-to-consume formats even as core Flower variety remains broad. Jenny Kush (3.5g) climbed +41.8% to rank 4 while Problem Child (3.5g) dropped -42.1% at rank 6, a spread that signals consumer sorting toward specific cultivar profiles rather than uniform Flower momentum. This mix suggests Farkas Farms / Bullseye Gardens is tilting toward a hero Pre-Roll to drive traffic while pruning underperforming Flower cuts, with June 2026 revenue concentrated in a few winners rather than even category lift, including one Flower SKU around $83,738 in sales.
Top Selling Cannabis Brands
Data for this report comes from real-time sales reporting by participating cannabis retailers via their point-of-sale systems, which are linked up with Headset’s business intelligence software. Headset’s data is very reliable, as it comes digitally direct from our partner retailers. However, the potential does exist for misreporting in the instance of duplicates, incorrectly classified products, inaccurate entry of products into point-of-sale systems, or even simple human error at the point of purchase. Thus, there is a slight margin of error to consider. Brands listed on this page are ranked in the top twenty within the market and product category by total retail sales volume.

