Mar-2025
Sales
Trend
6-Month
Product Count
SKUs
Overview
Market Insights Snapshot
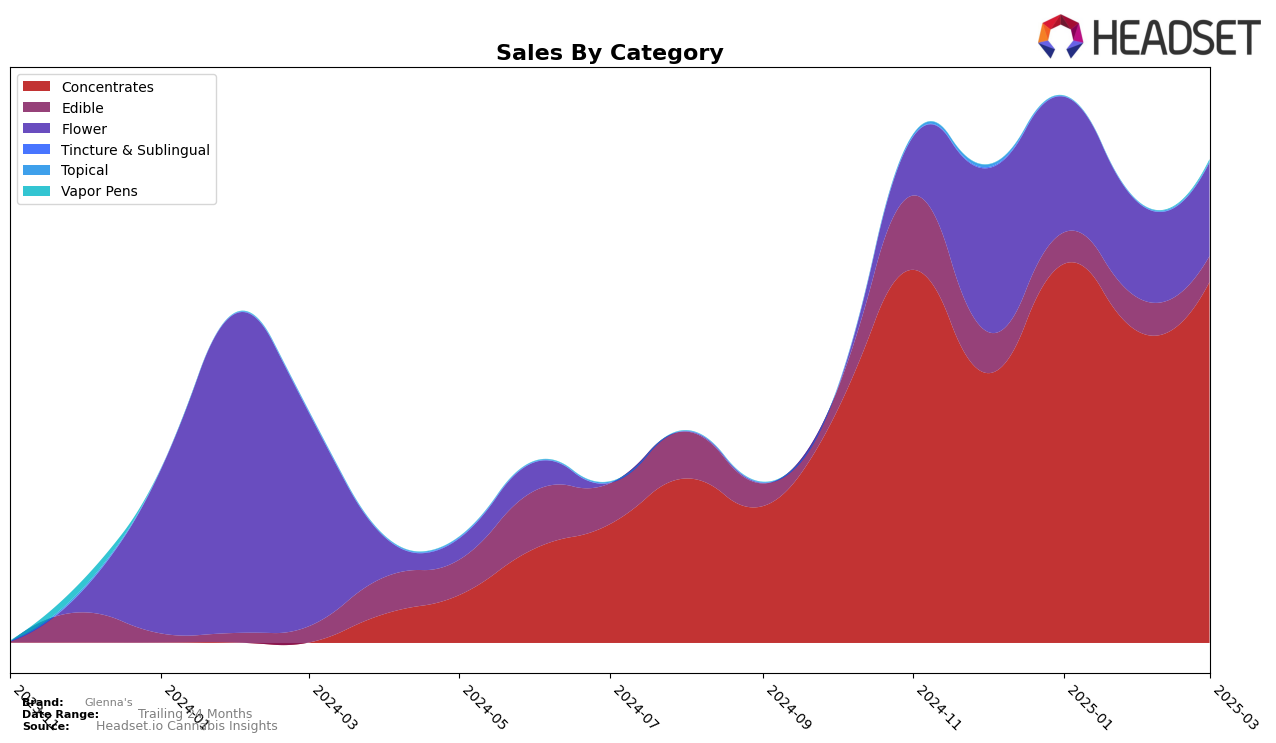
Glenna's has shown notable performance in the New York cannabis market, particularly within the Concentrates category. Over the months from December 2024 to March 2025, Glenna's has consistently ranked within the top 10, with a peak position of 5th in March 2025. This upward trajectory, coupled with a significant sales increase from December 2024 to January 2025, indicates a strengthening presence in the Concentrates category. However, in the Edibles category, Glenna's has struggled to break into the top 30, with rankings hovering in the low 50s, reflecting a more challenging market position in this segment. The brand's performance in the Flower category also highlights areas for potential improvement, as they failed to maintain a top 30 position by March 2025.
While Glenna's has shown strong growth in certain segments, the data suggests varying performance across categories. In the New York market, the brand's Concentrates have been a standout, whereas Edibles and Flower categories seem to be underperforming. The absence of a top 30 ranking in the Flower category by March 2025 indicates a significant drop in market competitiveness, which may require strategic adjustments. Conversely, the consistent presence in the top 10 for Concentrates suggests a robust strategy and consumer preference in this area. These insights provide a glimpse into Glenna's market dynamics and hint at areas where the brand might focus its efforts to bolster performance across all categories.
Competitive Landscape
In the competitive landscape of the New York concentrates market, Glenna's has shown a dynamic performance from December 2024 to March 2025. Initially ranked 8th in December, Glenna's climbed to 6th in January, experienced a slight dip to 8th in February, and then ascended to 5th place by March. This fluctuation in rank reflects Glenna's resilience and adaptability in a competitive environment. Notably, Jetpacks consistently maintained a top-tier position, ranking 3rd from December to February before slipping to 4th in March, indicating strong brand loyalty and market presence. Meanwhile, Hudson Cannabis demonstrated upward momentum, moving from 4th to 3rd place by March, potentially posing a challenge to Glenna's future ranking. Additionally, Olio and Blotter showed varied performances, with Olio improving from 11th to 7th and Blotter experiencing fluctuations between 6th and 8th positions. These shifts highlight the competitive pressures Glenna's faces, emphasizing the need for strategic marketing and product differentiation to maintain and improve its market position.

Notable Products
In March 2025, Glenna's top-performing product was Citradelic Sunset Cured Live Resin Sugar (1g) in the Concentrates category, maintaining its leading position for four consecutive months despite a gradual decline in sales, reaching 821 units. Cereal Milk Cured Resin (1g) held steady at the second rank since January, showing a slight increase in sales compared to February. Apex Cured Resin (1g) also remained consistent at the third position, experiencing a small uptick from February's sales. NYC Diesel Cured Resin Sugar (1g) maintained its fourth-place ranking with a notable sales increase from the previous month. Modified Grape (3.5g), categorized under Flower, retained the fifth position since February, indicating stable performance in the flower category.
Top Selling Cannabis Brands
Data for this report comes from real-time sales reporting by participating cannabis retailers via their point-of-sale systems, which are linked up with Headset’s business intelligence software. Headset’s data is very reliable, as it comes digitally direct from our partner retailers. However, the potential does exist for misreporting in the instance of duplicates, incorrectly classified products, inaccurate entry of products into point-of-sale systems, or even simple human error at the point of purchase. Thus, there is a slight margin of error to consider. Brands listed on this page are ranked in the top twenty within the market and product category by total retail sales volume.

