Mar-2025
Sales
Trend
6-Month
Product Count
SKUs
Overview
Market Insights Snapshot
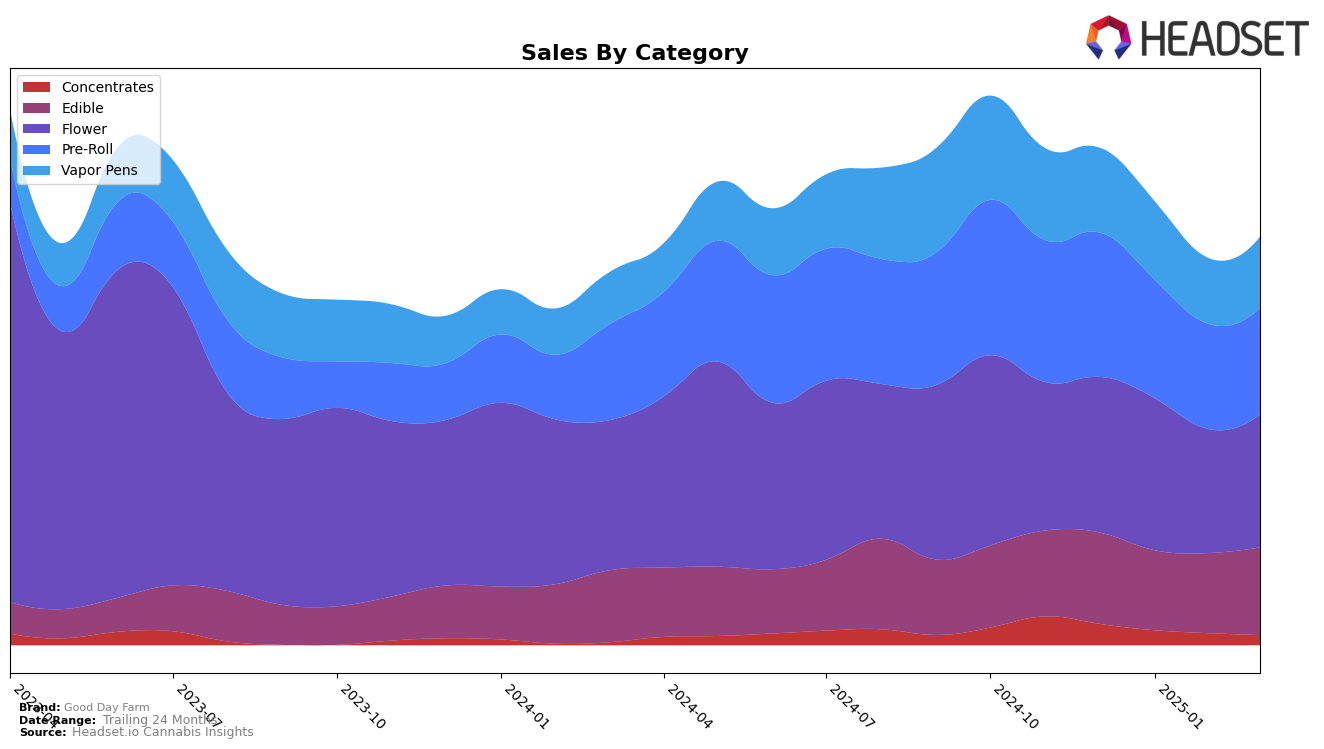
Good Day Farm has demonstrated a varied performance across different product categories in Missouri. In the Pre-Roll category, the brand has maintained a stronghold, consistently ranking first from December 2024 through March 2025. This consistency highlights the brand's dominance and consumer preference in this segment. However, in the Concentrates category, there has been a noticeable decline in ranking from fourth place in December 2024 to eleventh place by March 2025, indicating a potential area of concern or increased competition. The Vapor Pens category also saw some fluctuation, with Good Day Farm slipping from fourth to sixth place over the same period, suggesting a need for strategic adjustments to regain its previous standing.
In terms of the Edible category, Good Day Farm has shown stable performance, holding its ground at third place in December 2024 and maintaining a strong position in subsequent months, only slightly dropping to fourth place in February and March 2025. This stability indicates a steady consumer demand for their edible products. The Flower category, however, reveals some challenges with a drop from sixth to eighth place from January to March 2025, which could suggest increased competition or shifting consumer preferences. Notably, the brand's sales in the Flower category experienced a dip in February but rebounded slightly in March, hinting at potential recovery or seasonal influences. Overall, while Good Day Farm holds strong positions in some categories, there are clear opportunities for growth and improvement in others.
Competitive Landscape
In the competitive landscape of Missouri's flower category, Good Day Farm has demonstrated resilience and consistency in its market position. Over the four-month period from December 2024 to March 2025, Good Day Farm maintained a steady rank, fluctuating between 6th and 8th place. This stability is noteworthy given the competitive pressure from brands like Sinse Cannabis, which consistently ranked just above Good Day Farm, and Vibe Cannabis (MO), which showed an upward trend, moving from 8th to 6th place. Despite a dip in sales in February 2025, Good Day Farm managed to recover in March, indicating a potential rebound in consumer demand. Meanwhile, Local Cannabis Co. and Daybreak Cannabis remained lower in the rankings, suggesting that Good Day Farm is effectively maintaining its competitive edge in the Missouri market.

Notable Products
For March 2025, Good Day Farm's top-performing product was Big AF - Strawberry Pineapple Gummy (100mg), maintaining its number one rank for four consecutive months with sales of 8,882 units. Following closely, Big AF - Cranberry Grape Gummy (100mg) held its steady position at rank two, showing a consistent performance in sales. Big AF - Peach Mango Gummy (100mg) also remained in third place, with a noticeable increase in sales compared to February. The Nano - CBD/THC/CBN 1:1:1 Night Night Gummies 10-Pack climbed back to fourth place, recovering from a dip in February. Meanwhile, the Nano - CBD/THC/CBN Night Night Gummies 10-Pack dropped to fifth place, showing a slight decline in sales from the previous month.
Top Selling Cannabis Brands
Data for this report comes from real-time sales reporting by participating cannabis retailers via their point-of-sale systems, which are linked up with Headset’s business intelligence software. Headset’s data is very reliable, as it comes digitally direct from our partner retailers. However, the potential does exist for misreporting in the instance of duplicates, incorrectly classified products, inaccurate entry of products into point-of-sale systems, or even simple human error at the point of purchase. Thus, there is a slight margin of error to consider. Brands listed on this page are ranked in the top twenty within the market and product category by total retail sales volume.

