Jun-2026
Sales
Trend
6-Month
Product Count
SKUs
Avg Price
YoY Sales Change
YoY Price Change
Market Insights Snapshot
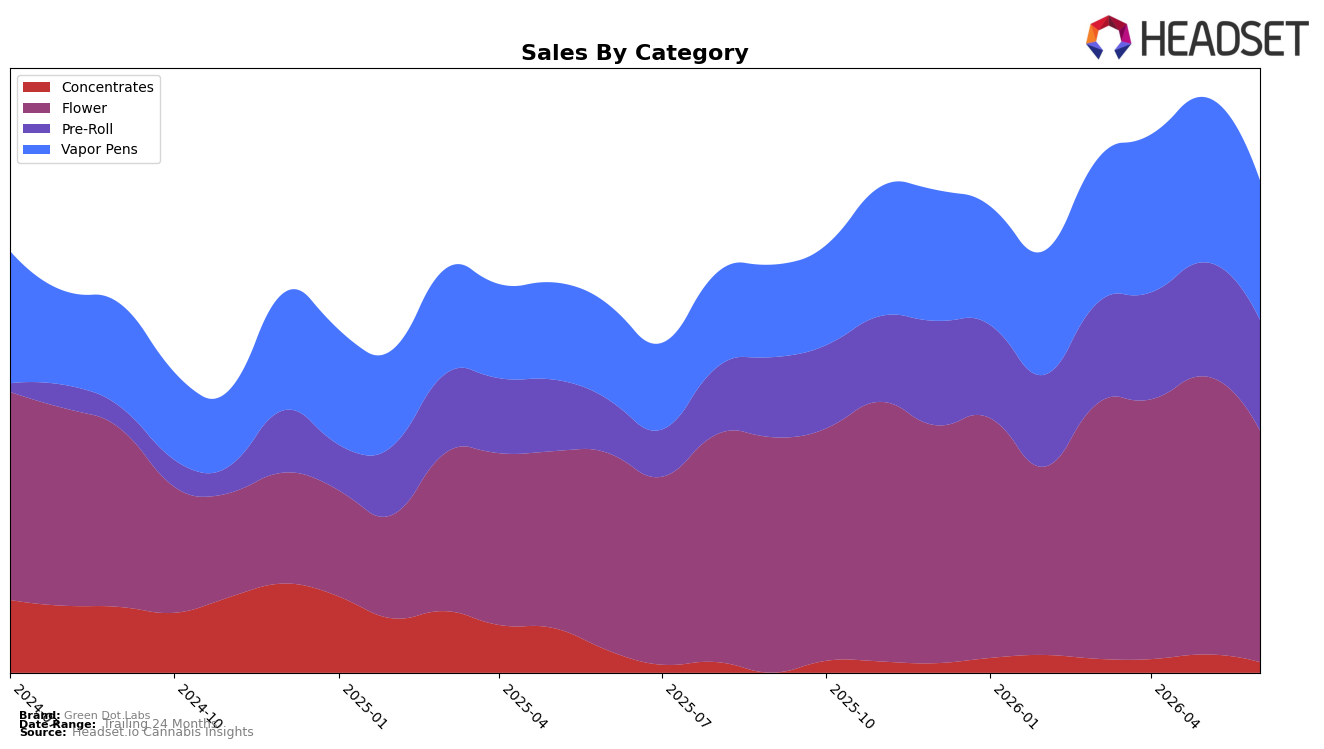
Green Dot Labs entered June 2026 with a category mix concentrated in Flower at 40.28% share and rank 4 in Colorado Flower, but Flower’s momentum is mixed: year over year it grew 13.64% while month over month it fell 13.94%. Vapor Pens account for 27.30% share with a 29.64% year-over-year increase but an 11.72% month-over-month decline, and Pre-Roll sits at 23.24% share with the sharpest year-over-year rise at 52.75% alongside a modest 2.02% month-over-month dip; meanwhile Concentrates hold 9.17% share with a 15.14% year-over-year decline and a 10.56% month-over-month drop. With brand-level sales up 21.17% year over year and average price down 12.01%, the pattern implies volume-led gains skewing toward Pre-Roll and Vapor Pens while Flower anchors scale but absorbs short-term price and mix pressure.
The shifts suggest a repositioning from a single-category anchor toward a three-pillar portfolio where Pre-Roll and Vapor Pens complement Flower’s scale: Pre-Roll’s 52.75% year-over-year growth against just a 2.02% month-over-month dip indicates resilient repeat demand at a lower average price point of $16.19, while Vapor Pens’ 29.64% year-over-year lift despite an 11.72% monthly pullback implies episodic volatility rather than trend reversal. Concentrates’ 15.14% year-over-year contraction paired with a 10.56% monthly decline signals a deprioritization risk, and Flower’s 13.94% monthly decline alongside a rank of 4 in Colorado indicates that defending Flower shelf space remains necessary even as mix migrates. Net, the category mix tilts Green Dot Labs toward higher-velocity, lower-ticket formats to sustain volume growth while Flower maintains brand visibility, implying pricing and pack architecture will be the primary levers rather than assortment expansion in Concentrates.
Competitive Landscape
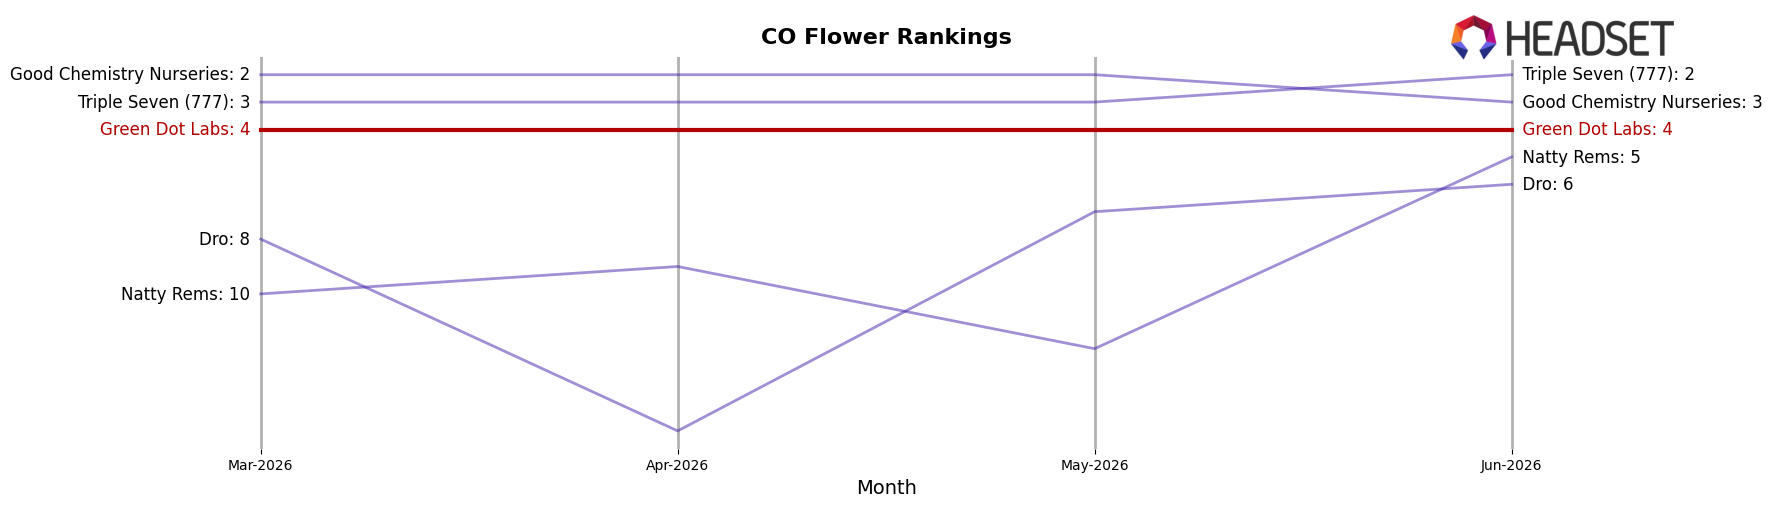
Green Dot Labs is ranked #4 in CO Flower for June 2026, unchanged from #4 year over year, and steady versus March 2026 at #4 while still trailing its peak of #3 from January 2026; in contrast, Seed & Strain Cannabis Co. moved from #2 to #1 with a 62.8% YoY sales increase, and Good Chemistry Nurseries slipped from #1 to #3 alongside a -2.8% YoY sales change, indicating Green Dot Labs is holding a stable #4 position as competitors trade places above it and below it, which implies a plateau that will require either share capture from the #3 spot or defense against Natty Rems climbing from #28 to #5 with 221.0% YoY growth.
Notable Products
Paloma Pre-Roll (1g) holds rank 1 while Pink Froot (3.5g) sits at rank 8, and eight of the top ten are Pre-Roll SKUs, indicating a category concentration that crowds Flower to a single slot. Red Froot Pre-Roll (1g) at rank 2 and Black Label - Bicycle Day Pre-Roll (1g) at rank 3 reinforce a stacked top tier, with ranks 1–7 and 9–10 dominated by Pre-Rolls and only one Flower SKU interrupting that run. With Paloma Pre-Roll (1g) generating $86,477 and multiple Black Label entries inside the top seven, the mix implies Green Dot Labs is orienting June 2026 assortment and demand capture toward premium and flavor-driven Pre-Rolls over Flower.
Top Selling Cannabis Brands
Data for this report comes from real-time sales reporting by participating cannabis retailers via their point-of-sale systems, which are linked up with Headset’s business intelligence software. Headset’s data is very reliable, as it comes digitally direct from our partner retailers. However, the potential does exist for misreporting in the instance of duplicates, incorrectly classified products, inaccurate entry of products into point-of-sale systems, or even simple human error at the point of purchase. Thus, there is a slight margin of error to consider. Brands listed on this page are ranked in the top twenty within the market and product category by total retail sales volume.

