.svg)

Sep-2026
Sales
Trend
6-Month
Product Count
SKUs
Avg Price
YoY Sales Change
YoY Price Change


Where to Buy
Happy Valley (MA) is stocked at 110 licensed dispensaries across Massachusetts, with the deepest coverage in Boston, Fall River, Holyoke, Pittsfield, and Somerville. Search by ZIP code or city below to find the closest one, or filter by product type if you are after a specific format.
Market Insights Snapshot
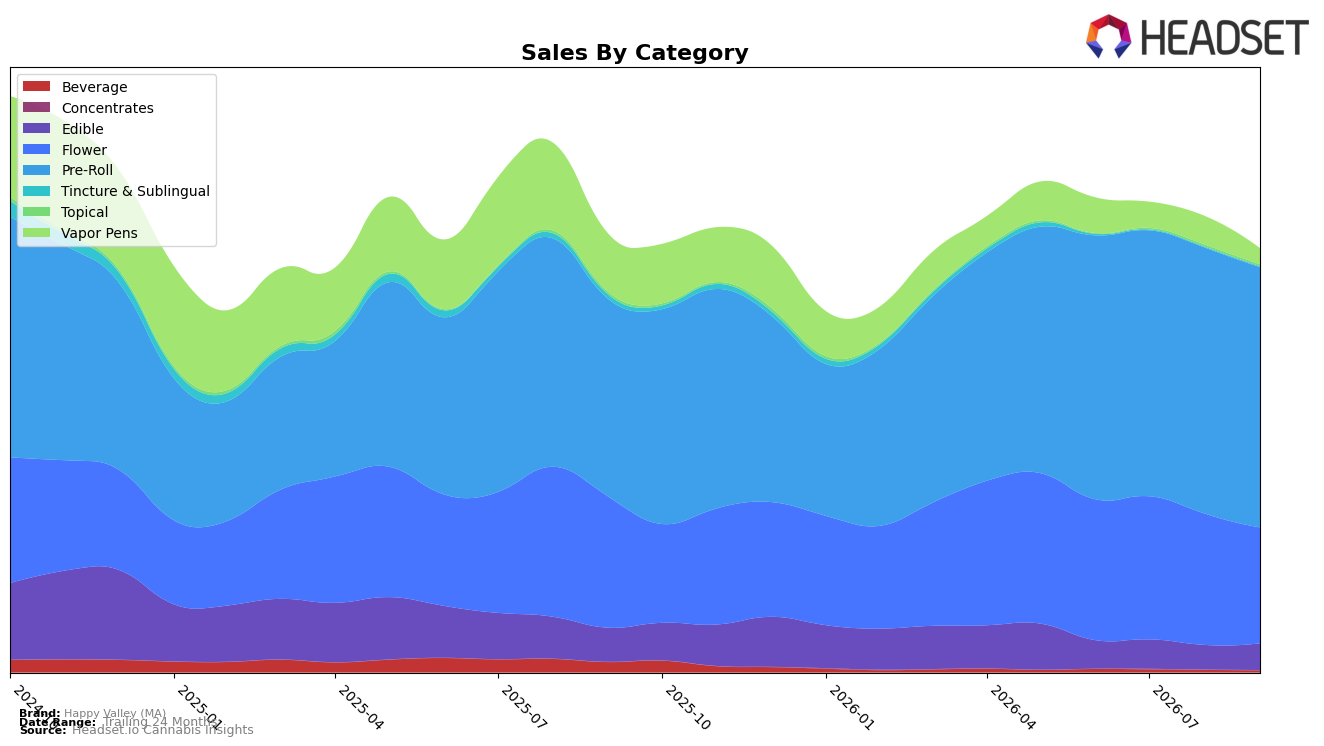
Happy Valley (MA) concentrated 61.52% of September 2026 sales in Pre-Roll, where sales were up 31.64% year over year but down 2.23% month over month, while Flower held 27.37% share with sales down 11.66% YoY and down 11.84% MoM. Smaller lines diverged: Edible at 6.27% share rose 8.75% MoM but fell 21.80% YoY, and Vapor Pens at 3.76% share declined 72.60% YoY and 43.83% MoM. Tincture & Sublingual lifted 27.56% MoM despite an 81.17% YoY drop, and Concentrates expanded 88.36% MoM off a minimal 0.03% share. With an average price down 23.66% YoY to $15.76 alongside brand sales down 3.33% YoY and 24-month sales down 23.52%, the mix implies intentional price-led volume defense centered on Pre-Roll as the anchor category.
Positioning in Massachusetts Pre-Roll at rank 7 pairs a growing category engine (Pre-Roll +31.64% YoY share-driver) with acute headwinds in Vapor Pens (-72.60% YoY) and Beverage (-81.08% YoY), suggesting a pivot away from underperforming inhalables and infused segments toward accessible formats. The simultaneous MoM contraction in Flower (-11.84%) and Pre-Roll (-2.23%) against MoM gains in Edible (+8.75%), Tincture & Sublingual (+27.56%), and Concentrates (+88.36%) indicates near-term experimentation at the margins while protecting the Pre-Roll core; the thesis is that holding a top-10 Pre-Roll position at 61.52% mix can offset volatility in small categories but caps upside unless Flower’s 27.37% share reverses its double-digit MoM drag.
Competitive Landscape
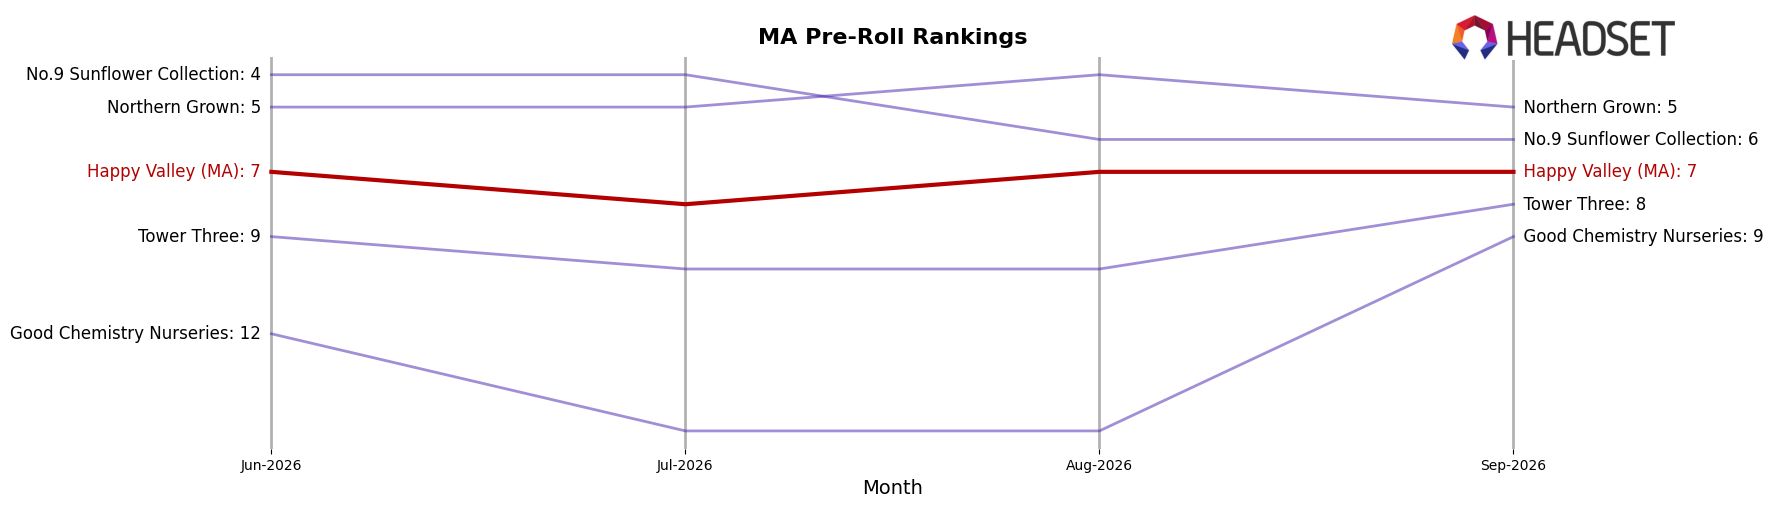
Happy Valley (MA) sits at rank 7 in September 2026, a 1-place improvement from rank 8 year over year, yet flat versus June 2026 at rank 7; the brand also trails its April 2026 peak of rank 5 by 2 positions, indicating incremental gains without reclaiming prior momentum. Meanwhile, Jeeter holds rank 1 with a 0-place YoY change and sales up 25.6%, and Northern Grown advanced from rank 10 to rank 5 alongside 97.6% YoY sales growth, outpacing Happy Valley (MA)’s rank stability; this mix of modest upward drift year over year and stagnation quarter to quarter implies a plateau where share is defended but leadership is slipping further out of reach without a catalyst to reaccelerate toward the prior rank 5 ceiling.
Notable Products
White Wedding Pre-Roll (1g) posted the steepest movement in September 2026 with a -41.7% month-over-month drop and a slide to rank 5, while Banana Jealousy Pre-Roll (1g) inched up just +2.5% but held the top spot at rank 1. Super Lemon Haze (3.5g) advanced +27.7% to rank 4 as Super Lemon Haze Pre-Roll (1g) climbed +17.8% at rank 2, and four of the top ten are Pre-Roll SKUs, signaling concentration in a single format despite mixed momentum. The Banana Jealousy Pre-Roll 7-Pack (3.5g) debuted at rank 8 with $76,987 in sales and the Lemon Smuggler Pre-Roll (1g) jumped +38.9% to rank 7, implying a pivot toward value and variety packs within Pre-Rolls while Flower gains share through a single, fast-moving strain.
Top Selling Cannabis Brands






Data for this report comes from real-time sales reporting by participating cannabis retailers via their point-of-sale systems, which are linked up with Headset’s business intelligence software. Headset’s data is very reliable, as it comes digitally direct from our partner retailers. However, the potential does exist for misreporting in the instance of duplicates, incorrectly classified products, inaccurate entry of products into point-of-sale systems, or even simple human error at the point of purchase. Thus, there is a slight margin of error to consider. Brands listed on this page are ranked in the top twenty within the market and product category by total retail sales volume.

