Nov-2025
Sales
Trend
6-Month
Product Count
SKUs
Overview
Market Insights Snapshot
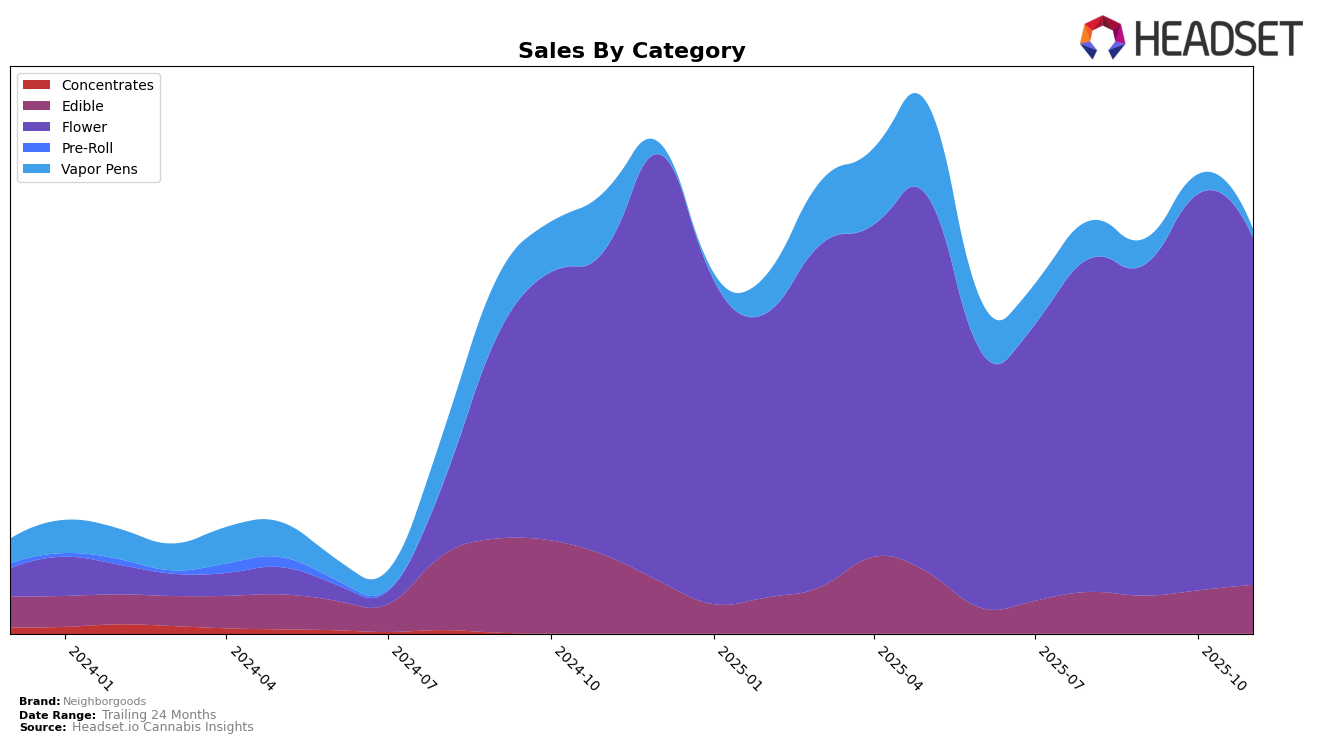
Neighborgoods has shown varied performance across different categories in Ohio. In the Edible category, the brand has experienced a notable upward trend, moving from the 12th position in September 2025 to the 10th rank by November 2025, suggesting a positive reception among consumers. This improvement is reflected in their sales figures, which saw a significant increase from $274,685 in September to $353,511 in November. Meanwhile, in the Flower category, Neighborgoods maintained a strong presence, peaking at the 2nd position in October before settling at 4th in November. This indicates a stable demand for their Flower products, although there was a slight decline in sales from October to November.
Conversely, the Vapor Pens category presents a different story for Neighborgoods in Ohio. The brand's ranking fell from 24th in August to being outside the top 30 by November, indicating a challenging market position in this segment. This drop in ranking is accompanied by a decrease in sales, which declined steadily from August to October. The absence of a ranking in November highlights the brand's struggle to capture market share in the Vapor Pens category. Such variations across categories underscore the dynamic nature of consumer preferences and the competitive landscape Neighborgoods faces.
Competitive Landscape
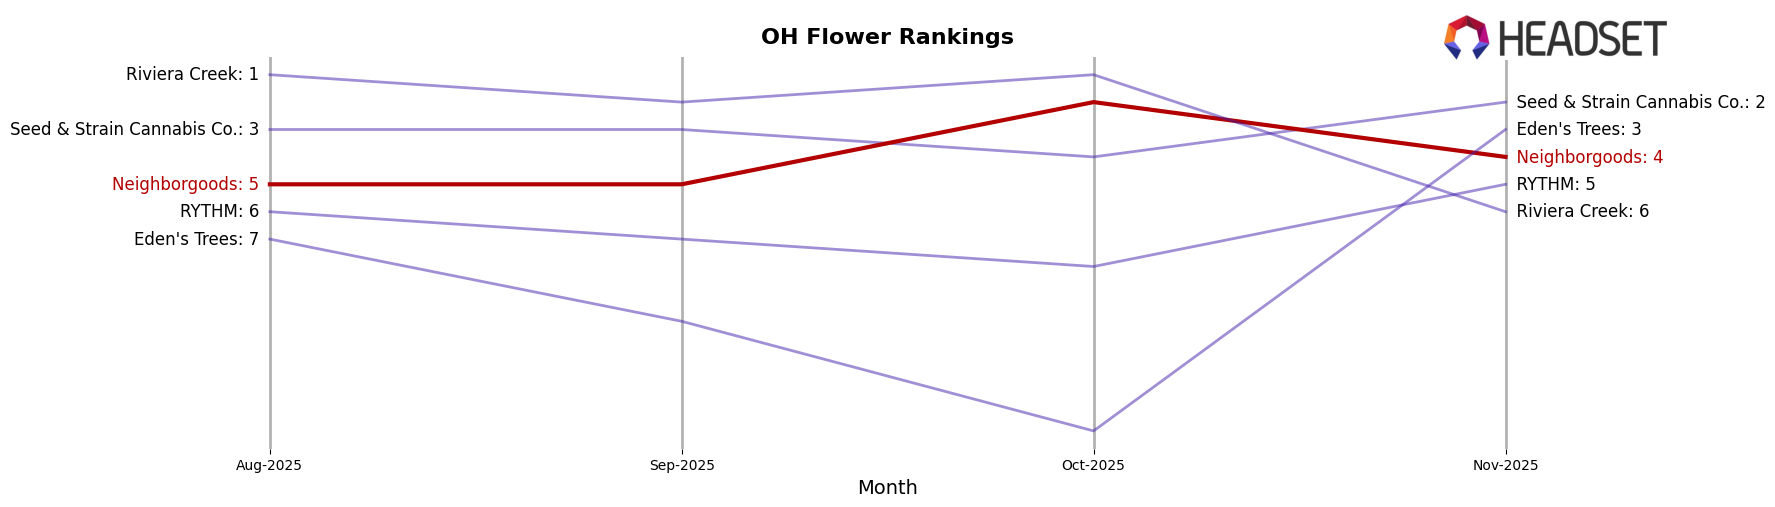
In the competitive landscape of the Flower category in Ohio, Neighborgoods has demonstrated notable fluctuations in its market position over recent months. While Neighborgoods ascended to the 2nd rank in October 2025, a significant improvement from its 5th place in August and September, it experienced a slight decline to 4th place in November. This shift is particularly interesting when compared to competitors like Seed & Strain Cannabis Co., which consistently maintained a strong position, moving from 3rd to 2nd place in November. Meanwhile, RYTHM and Riviera Creek also experienced rank changes, with RYTHM climbing to 5th place in November and Riviera Creek dropping to 6th, indicating a dynamic market environment. Notably, Eden's Trees made a remarkable leap from 14th place in October to 3rd in November, highlighting the volatility and competitive nature of the Ohio Flower market. These shifts suggest that Neighborgoods must continue to innovate and adapt to maintain and improve its standing amidst strong competition.
Notable Products
In November 2025, Black Amber (2.83g) emerged as the top-performing product for Neighborgoods, securing the number one rank with sales of 5634 units. This product showed a consistent climb from its third position in October. Melonade #8 (2.83g), although dropping from its top spot in October, maintained a strong second place. Black Amber (14.15g) entered the rankings for the first time, achieving a commendable third position. Spritz (2.83g) rounded out the top four, dropping from its previous second-place ranking in September.
Top Selling Cannabis Brands
Data for this report comes from real-time sales reporting by participating cannabis retailers via their point-of-sale systems, which are linked up with Headset’s business intelligence software. Headset’s data is very reliable, as it comes digitally direct from our partner retailers. However, the potential does exist for misreporting in the instance of duplicates, incorrectly classified products, inaccurate entry of products into point-of-sale systems, or even simple human error at the point of purchase. Thus, there is a slight margin of error to consider. Brands listed on this page are ranked in the top twenty within the market and product category by total retail sales volume.

