Market Insights Snapshot
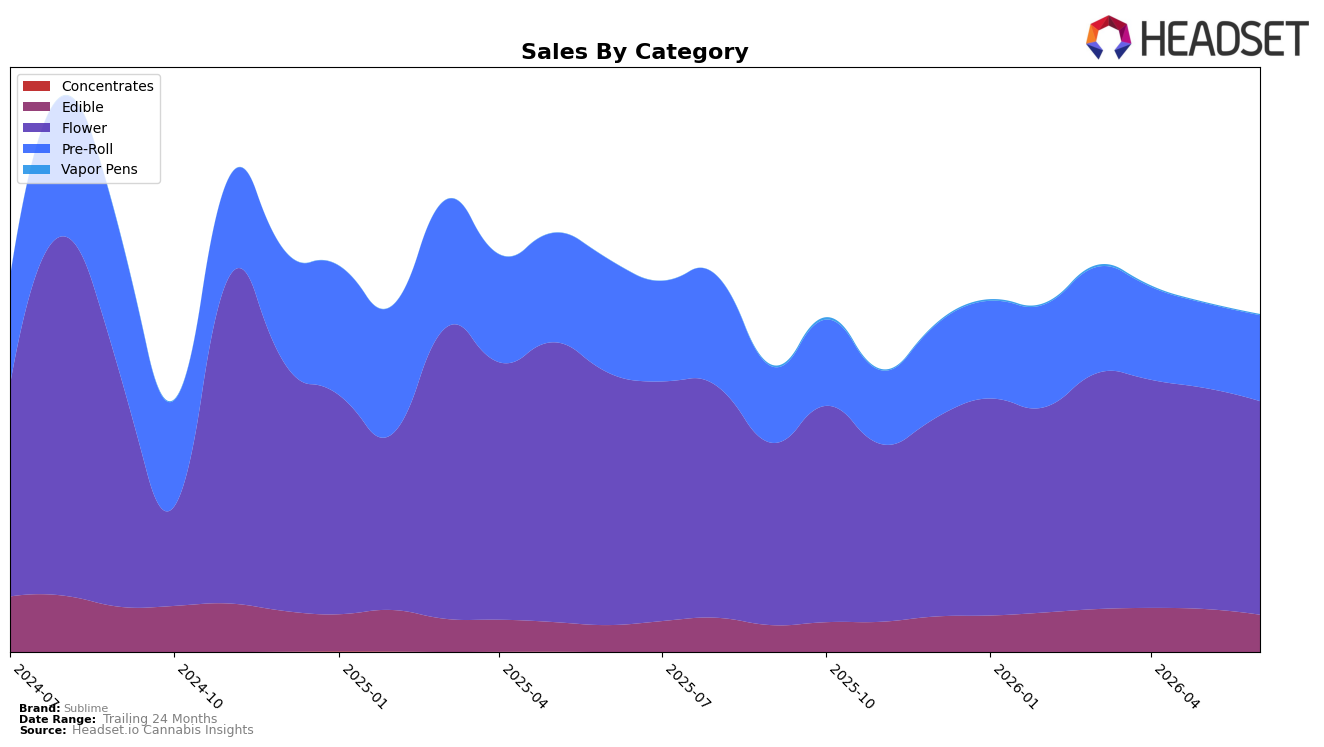
In June 2026, Sublime concentrated 63.33% of sales in Flower with a year-over-year decline of 15.38% and a month-over-month dip of 3.37%, while Pre-Roll held 25.42% share with a 24.49% YoY contraction but a 1.24% MoM lift. Edible expanded 38.83% YoY to 10.98% share yet fell 13.40% MoM, and Vapor Pens remained a 0.27% niche with a 15.43% MoM uptick and no YoY comp. With the brand’s overall sales down 14.10% YoY alongside a 10.48% YoY increase in average price and a rank of 26 in Flower in Missouri, the mix signals reliance on a contracting core and a small but growing long tail; this pattern implies near-term volume pressure concentrated in Flower offset partially by experimentation in smaller formats.
The mix shifts imply that Sublime’s positioning is anchored to Flower where rank 26 in Missouri limits visibility, while Edible’s 38.83% YoY growth and Pre-Roll’s 1.24% MoM recovery indicate incremental reach among value and occasion-driven buyers despite a 24.49% YoY decline in Pre-Roll. The 10.48% YoY increase in average price alongside a 15.38% YoY decline in Flower and a 13.40% MoM pullback in Edible suggests price drift toward premiumization without sustained basket expansion; this pattern implies that defending Flower volume while codifying Edible gains is the pivotal trade-off for share stabilization.
Competitive Landscape
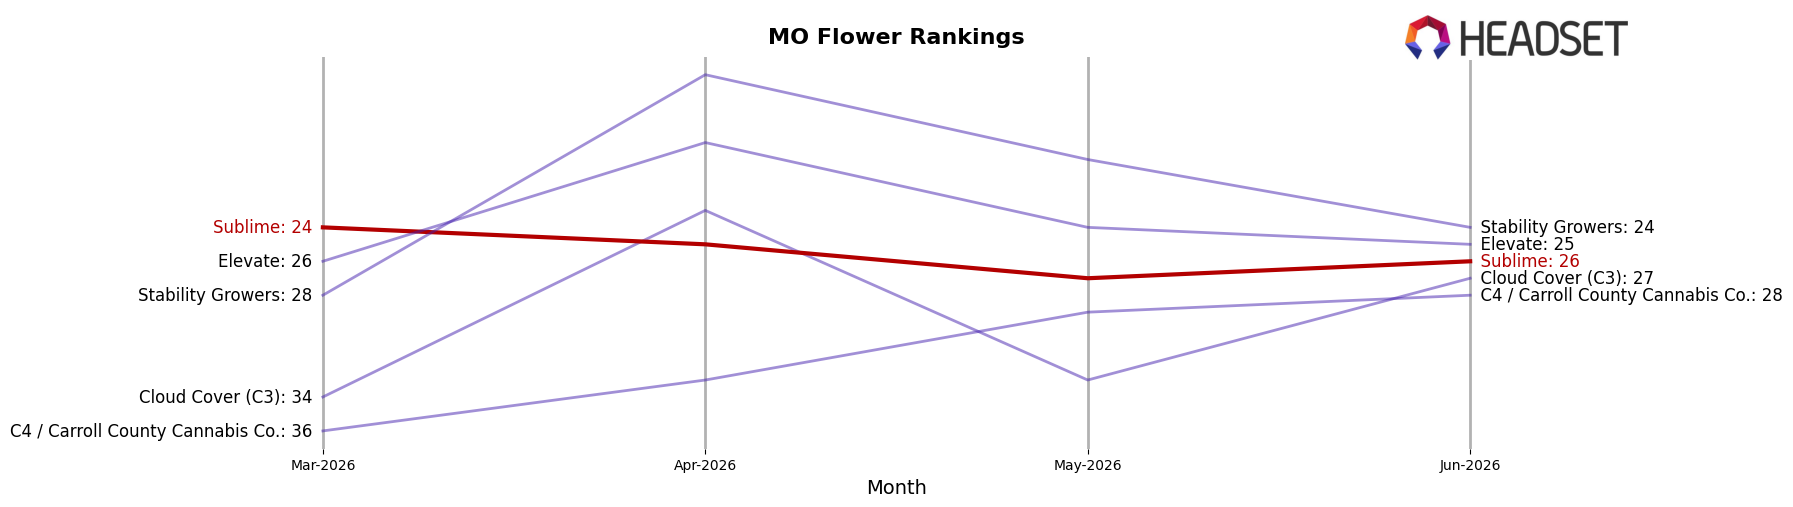
Sublime sits at rank #26 in June 2026 in MO Flower, an improvement of 2 positions YoY from #28 and a 2-position drop since March 2026 when it held #24; against its historical ceiling of #20 from August 2024, this places the brand 6 ranks below peak. In the same period, Sinse Cannabis climbed from #5 to #2 while Flora Farms held at #1 despite a 5.1% YoY sales decline, indicating that upward mobility is achievable for challengers even as the category leader contracts. The combination of a modest YoY rank gain (+2) alongside a recent quarter-over-quarter slippage (-2 vs March 2026) implies a plateauing trajectory where maintaining top-25 relevance will require arresting short-term share erosion rather than relying on gradual annual improvement.
Notable Products
Hot Rod - Cherry Dream 91 Infused Pre-Roll (0.5g) posted the steepest decline at -21.0% MoM while dropping to rank 10, and Hot Rod - GDP Infused Pre-Roll (0.5g) fell -14.8% at rank 3, signaling pressure within the infused SKUs segment. Moonbow 112 IX Pre-Roll (1g) held rank 1 with $41,285 in June 2026, while Hot Rod - Blue Dream Infused Pre-Roll (0.5g) slid -14.9% at rank 5, and four of the top ten are Pre-Roll SKUs from the Hot Rod infused line concentrated between ranks 2–10. The lone MoM gainer among named SKUs was Hot Rod - Berry Blackout Infused Pre-Roll (0.5g) at +21.3% to rank 2, contrasting with Hot Rod - Slaughter Berry Infused Pre-Roll (0.5g) at -16.2% in rank 9, indicating divergence within similar flavor variants. The mix implies Sublime is consolidating around a flagship non-infused leader supported by a volatile infused portfolio, pointing to a need to rebalance toward fewer but higher-converting infused variants.
Top Selling Cannabis Brands
Data for this report comes from real-time sales reporting by participating cannabis retailers via their point-of-sale systems, which are linked up with Headset’s business intelligence software. Headset’s data is very reliable, as it comes digitally direct from our partner retailers. However, the potential does exist for misreporting in the instance of duplicates, incorrectly classified products, inaccurate entry of products into point-of-sale systems, or even simple human error at the point of purchase. Thus, there is a slight margin of error to consider. Brands listed on this page are ranked in the top twenty within the market and product category by total retail sales volume.

